Download

1 / 20
200 likes | 215 Views
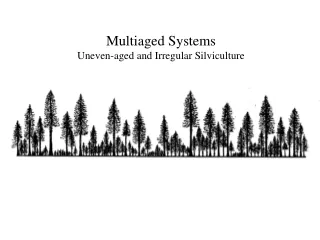
Uneven-aged Management I. Lecture 9 (5/1/2017). Definitions:. Uneven-aged stand: 3< age classes at all times (ideally, all age-classes are present up to a maximum);

E N D
Uneven-aged Management I. Lecture 9 (5/1/2017)
Definitions: • Uneven-aged stand: 3< age classes at all times (ideally, all age-classes are present up to a maximum); • Uneven-aged management: the process of making decisions to best achieve ownership objectives while maintaining an uneven-aged structure
Advantages of uneven-aged management • Constant forest cover (good for erosion control); • Frequent incomes from the stand; • Provides a specific type of wildlife or plant habitat (diverse tree sizes, multilayered canopy); • An uneven-aged stand is never clearcut (aesthetically pleasing); • Low investment requirements because it relies on natural regeneration; • If shade-tolerant species are in the mix of desired species composition, uneven-aged management is the best tool to maintain that mix.
Disadvantages of uneven-aged management • Does not work well with shade-intolerant species (e.g., most pines, Douglas fir, aspen, black cherry), etc..; • Many wildlife species prefer openings, early successional or mature forest patches; • Requires more detailed info about the stand; • Complexity: difficult to achieve and maintain; • More frequent entries and lighter harvests mean (1) higher logging costs per unit wood removed, (2) more damage to residual stand, and (3) more compaction, rutting (i.e., more site degradation); • High-grading is often practiced in the name of uneven-aged management.
The key decisions in uneven-aged management • Target diameter-class distribution decision; • The cutting cycle decision; • Individual tree harvesting decision. We will assume that an uneven-aged stand already exists and we will not discuss how to convert an even-aged stand to an uneven-aged stand.
The target diameter-class distribution • The Q factor: determines the relative balance between smaller and larger trees: • The stand basal area (BA): must be low enough to ensure adequate regeneration, yet high enough to maximize the use of the site. • Maximum diameter (dmax): specifies the size at which trees become mature and their future growth would not financially justify to keep them any longer.
The cutting cycle • Short cutting cycles: • frequent harvests with too little volume, • higher average harvesting costs, • density can be kept close to optimal for growth and regeneration. • Long cutting cycles: • The stand will deviate far from the target diameter-class distribution, • Too sparse at the beginning of the cutting cycle and too dense at the end of it.
The individual tree harvesting decision • Individual trees must be selected to be cut in diameter-classes with surplus stocking; • Undesirable trees should be removed first: those that have defects, insect or disease problems, and undesirable species; • Trees with the least potential to increase in quality sawlog value should go next.
The Negative Exponential Diameter-class Distribution provides a constant Q: A proof that Now, use the fact that:
The Negative Exponential Diameter-class Distribution (cont.) • “a” is like the slope of the diameter-class distribution function; • “k” is the intercept. Proof: • Parameter k is a measure of the amount of regeneration that is needed at any point in time in order to maintain the diameter- class distribution.
Example #1: Calculating Q from a. Determine the Q factor for the following diameter-class distribution function: Answer: • Example #2: Calculating a from Q. What value of the a parameter gives a negative exponential diameter-class distribution function with a Q=1.3? Answer:
Determining the parameters of the negative exponential function • Example #1: From Q and n(1). Determine the specific form of the negative exponential function with a Q factor of 1.1 and 180 trees in the 1-inch diameter-class (n(1) = 180) Answer: The specific form then is:
Determining the parameters of the negative exponential function (cont.) • Example #2: From two points. Determine the specific form of the negative exponential function that gives 80 trees in the 3-inch diameter-class (n(3) = 80) and 45 trees in the 6-inch diameter-class (n(6) = 45) . Answer:
Review of the negative exponential function • Constant Q; • Two parameters: a (slope), k (intercept or regen needed); • You need a and k to identify the specific form of the function; • You can calculate a and k from Q and one point on the curve or from two points on the curve.
Selecting a Q-factor • We need a (slope), k (intercept or regeneration), and dmax. • Step 1: Select dmax; • Step 2: Select Q (which, in turn, defines a); • Step 3: Select k (equivalent to selecting a target basal area).
Selecting a Q-factor (cont.) • The basal area decision is driven by the need to acquire adequate regeneration while maximizing the utilization of the site. • The selection of k is a silvicultural decision; • The selection of dmax and Q are management decisions.
Regeneration • The relationship between stand basal area and the amount of regeneration in the stand: • Negative slope, and • The function is 0 at or above basal areas of 80-90 ft2. • E.g., it can look like this: