Download
1 / 44
440 likes | 444 Views
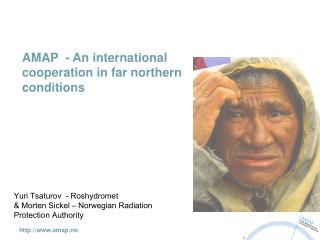
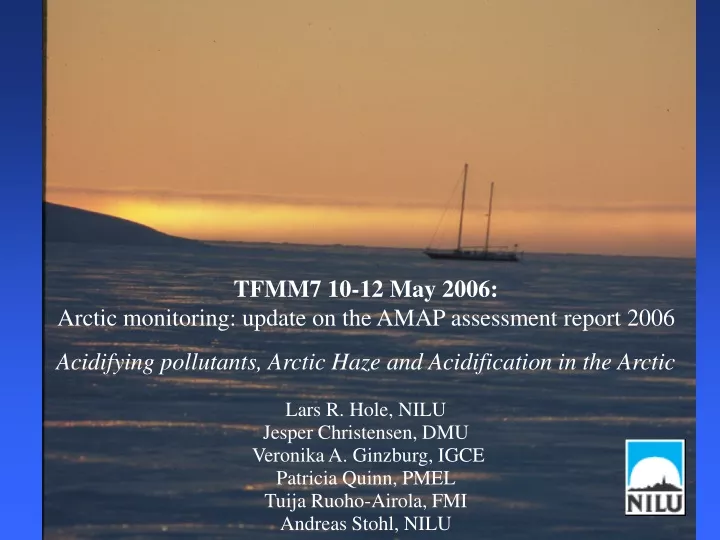
TFMM7 10-12 May 2006: Arctic monitoring: u pdate on the AMAP assessment report 2006 Acidifying pollutants, Arctic Haze and Acidification in the Arctic Lars R. Hole, NILU Jesper Christensen, DMU Veronika A. Ginzburg, IGCE Patricia Quinn, PMEL Tuija Ruoho-Airola, FMI Andreas Stohl, NILU.

E N D
TFMM7 10-12 May 2006:Arctic monitoring: update on the AMAP assessment report 2006 Acidifying pollutants, Arctic Haze and Acidification in the Arctic Lars R. Hole, NILUJesper Christensen, DMU Veronika A. Ginzburg, IGCE Patricia Quinn, PMELTuija Ruoho-Airola, FMIAndreas Stohl, NILU
”Arctic Haze” first observed in the 1950s by pilots Few pollution sources within the Arctic itself, Arctic remote from major pollution sources Long-range transport, mostly from Eurasia Removal processes very slow or absent (wet / dry deposition, photochemical processing) Shaw (1995): BAMS76, 2403-2413
The Arctic age of air Time spent continuously north of 70°N - Lowest 100 m of the troposphere July January Note the different scales!!!
Time series of monthly averaged particulate sulfate and nitrate concentrations in ugS/m3 and ugN/m3, respectively, for a) Barrow, Alaska and b) Alert, Canada.
Annual SO2 values at Svanvik and emissions from Nikel (Hagen et al., 2005).
Temporal trends for sulphate concentrations in air in micrograms/m3. Red line: summer, blue line: winter.
Temporal trends for nitrate concentrations in air in micrograms/m3. Red line:summer, blue line: winter.
Temporal trends for weighted sulphate concentrations in precipitation in mg/l. Red line:summer, blue line: winter.
Temporal trends for weighted nitrate concentrations in precipitation in mg/l. Red line:summer, blue line: winter.
Monthly averaged concentrations in gS m-3 of sulfate for March and April.
Monthly averaged concentrations in g N m-3 of nitrate for March and April
Zonal mean potential temperature, DJF ”Polar Dome” pressure
Pathways for Black Carbon (lifetime 8-10 days) Europe Asia 1. Fast low-level transport over Scandinavia and uplift in the Arctic (blocking-type situations) – not really in the polar dome, but important for both concentrations and depositions in the Arctic 2. Low-level transport across Siberia – sideways transport into the polar dome; important for concentrations – only in winter 3. Lifting outside the Arctic – pollution would be removed 1. X 2. X 3. Lifting outside the Arctic – pollution would be removed
The Danish Eulerian Hemispherical Model (Jesper Christensen, DMU) • Based on MM5 mesoscale model • Emissions on 1ox1o grid from the EDGAR database(SO2, NOx, and VOC) + EMEP (50 k) • NH3 and NOx from lightning and soil emissions from global GEIA are used • Two emission scenarios: • A “Current Legislation” (CLE) • B “Maximum technically Feasible Reduction” (MFR)
Mean surface concentrations of SOx (SO2+SO4) (left) and NO3 (right) for the year 2000.
Scenarios: Emissions of SO2 for the “Current legislation” (left) and “Maximum technically Feasible Reduction” (right) for the year 2020
The total mean concentrations and total depositions of SOx for the area north of Arctic Circle for the different emissions scenarios.
The total mean concentrations and total depositions of NOy for the area north of the Arctic Circle for the different emissions scenarios.
Black Carbon: Vertical profile for the Arctic area North of Polar Circle.
RRecommendations EEstablish additional background stations for air and precipitation chemistry in North America (Northern Canada and Alaska). Barrow chemistry should be continued and that SO2 be added.Monitoring data for air concentrations (background) in Russian Arctic – same stations as precipitation - establish stations.Station Nord should be re-opened.
RRecommendations ctd MMeasurements during field campaigns, e.g., during summer season to obtain dry deposition velocities for model improvement. UUse of measurements for model validation for S and N species and black carbon. AAMAP should have better linkage with other programs such as EMEP and EANET and national experts (particularly in Russia, but also North America). Monthly data from Russian precipitation data (18 stations) should be reported to AMAP database.
Arctic pollution is still an issue!-extreme transport event on Svalbard May 2006 Photo: Ann-Christine Engvall,Univ. Stockholm
Climate change might affect pathways Photo: Ann-Christine Engvall,Univ. Stockholm
Member countries (the eight Arctic rim countries): Canada, Denmark/Greenland, Finland, Iceland, Norway, Russia, Sweden, United States Permanent participants (the indigenous peoples organizations): Inuit Circumpolar Conference (ICC), Saami Council, Russian Association of Indigenous Peoples of the North (RAIPON), Aleut International Association (AIA) Observing countries: Germany, Netherlands, Poland, United KingdomNorway has the AMAP secretariat and the atmospheric data centre at the Norwegian Institute of Air Research (NILU)
• producing integrated assessment reports on the status and trends of the conditions of Arctic ecosystems; • identifying possible causes for changing conditions; • detecting emerging problems, their possible causes, and the potential risk to Arctic ecosystems including indigenous peoples and other Arctic residents; • recommending actions required to reduce risks to Arctic ecosystems.
a) - sulfur sulfate Turukhansk c) - sulfur sulfate, Norilsk;