Download
1 / 11
120 likes | 131 Views
Tim Hurley. Spectrograms: Music Sampling and Discrete Fourier Coefficients. Spectrograms. Spectrograms are used to identify and analyze sounds Typically, x-axis represents time and y-axis represents frequency Spectrograms are used to visually represent a Discrete Fourier Transform.

E N D
Tim Hurley Spectrograms: Music Sampling and Discrete Fourier Coefficients
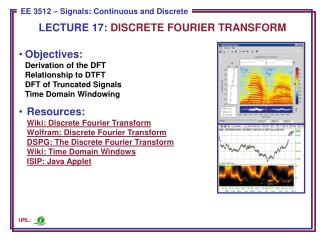
Spectrograms • Spectrograms are used to identify and analyze sounds • Typically, x-axis represents time and y-axis represents frequency • Spectrograms are used to visually represent a Discrete Fourier Transform
Two Ways • First way: Filters • The filter takes frequencies and passes them through and rejects frequencies that are outside of the given range
Second way: Fourier coefficients • We already did that!! • Nooooo, we found something different. • Waves are continuous sinusoidal functions. • Finding the Fourier coefficients for these produced an infinite series numbers • Computers don’t like infinite numbers
What we did • Recall that we wanted to find Fourier coefficients in order to find an approximation for the square wave • We took the integral from 0 to 2π and looked at different cases and found the form for an and bn. • This produced infinite number of values
What I did • I started with a similar equation and took the summation of it from 0 to N-1 • N = number of samples within a given window • Difficulties arose because I had to use multiple trig identities in order to re-write the sums/products of sinusoids so they were able to be manipulated. • After tedious trig work I was able to determine the form of the coefficients
Why does that have to do with spectrograms??? • Good question! • Discrete Fourier Transform looks at a small windows of a sound signal. • Breaks this window into N small fractions of seconds (ex: 0.0005 secs) • Determines the discrete Fourier coefficients for this section • Coefficients represent intensities of different frequencies of the wave • These numbers are graphed and the process is repeated
For Example Blue = higher intensity frequency Red = medium intensity frequency Yellow = low intensity frequency This will happen for every ‘window’ until entire sound is analyzed and graphed
“Philip’s Research” “–e–” “–s” “–ch” “Philip–” “–sear–” “re–” www.seeingwithsound.com/javoice.htm
The End Questions?? By the way, this is my last assignment as an undergrad student