Download
1 / 91
930 likes | 1.15k Views
Five kingdom system (Haeckel, 1879). mammals. vertebrates. animals. invertebrates. plants. fungi. protists. protozoa. monera. We will use MEGA to make phylogenetic trees. Open the alignment editor…. Choose DNA or protein….

E N D
Five kingdom system (Haeckel, 1879) mammals vertebrates animals invertebrates plants fungi protists protozoa monera
Open the alignment editor… Choose DNA or protein… Paste in sequences in the fasta format or as a multiple sequence alignment…
You can use a set of protein or DNA sequences in the fasta format obtained from HomoloGene
Use MEGA to make phylogenetic trees Trees show the evolutionary relationships among proteins, or DNA sequences, or species…
Introduction Charles Darwin’s 1859 book (On the Origin of Species By Means of Natural Selection, or the Preservation of Favoured Races in the Struggle for Life) introduced the theory of evolution. To Darwin, the struggle for existence induces a natural selection. Offspring are dissimilar from their parents (that is, variability exists), and individuals that are more fit for a given environment are selected for. In this way, over long periods of time, species evolve. Groups of organisms change over time so that descendants differ structurally and functionally from their ancestors.
Introduction At the molecular level, evolution is a process of mutation with selection. Molecular evolution is the study of changes in genes and proteins throughout different branches of the tree of life. Phylogeny is the inference of evolutionary relationships. Traditionally, phylogeny relied on the comparison of morphological features between organisms. Today, molecular sequence data are also used for phylogenetic analyses.
Goals of molecular phylogeny Phylogeny can answer questions such as: • How many genes are related to my favorite gene? • How related are whales, dolphins & porpoises to cows? • Where and when did HIV or other viruses originate? • What is the history of life on earth? • Was the extinct quagga more like a zebra or a horse?
Molecular clock hypothesis In the 1960s, sequence data were accumulated for small, abundant proteins such as globins, cytochromes c, and fibrinopeptides. Some proteins appeared to evolve slowly, while others evolved rapidly. Linus Pauling, Emanuel Margoliash and others proposed the hypothesis of a molecular clock: For every given protein, the rate of molecular evolution is approximately constant in all evolutionary lineages Implications: If protein sequences evolve at constant rates, they can be used to estimate the times that sequences diverged. This is analogous to dating geological specimens by radioactive decay.
2 A F 1 1 G B 2 I H 2 C 1 D 6 E time Molecular phylogeny uses trees to depict evolutionary relationships among organisms. These trees are based upon DNA and protein sequence data. A 2 1 1 B 2 C 2 2 1 D 6 one unit E
2 A F 1 1 G B 2 I H 2 C 1 D 6 E time Tree nomenclature taxon taxon A 2 1 1 B 2 C 2 2 1 D 6 one unit E
2 A F 1 1 G B 2 I H 2 C 1 D 6 E time Tree nomenclature operational taxonomic unit (OTU) such as a protein sequence taxon A 2 1 1 B 2 C 2 2 1 D 6 one unit E
2 A F 1 1 G B 2 I H 2 C 1 D 6 E time Tree nomenclature Node (intersection or terminating point of two or more branches) branch (edge) A 2 1 1 B 2 C 2 2 1 D 6 one unit E
2 A F 1 1 G B 2 I H 2 C 1 D 6 E time Tree nomenclature Branches are unscaled... Branches are scaled... A 2 1 1 B 2 C 2 2 1 D 6 one unit E …OTUs are neatly aligned, and nodes reflect time …branch lengths are proportional to number of amino acid changes
2 A F 1 1 G B 2 I H 2 C 1 D 6 E time Tree nomenclature bifurcating internal node multifurcating internal node A 2 1 B 2 C 2 2 1 D 6 one unit E
Examples of multifurcation: failure to resolve the branching order of some metazoans and protostomes Rokas A. et al., Animal Evolution and the Molecular Signature of Radiations Compressed in Time, Science 310:1933 (2005), Fig. 1.
Tree nomenclature: clades Clade ABF (monophyletic group) A 2 F 1 1 B G 2 I H 2 C 1 D 6 E time
Tree nomenclature 2 A F 1 1 G B 2 I H 2 C Clade CDH 1 D 6 E time
Tree nomenclature Clade ABF/CDH/G 2 A F 1 1 G B 2 I H 2 C 1 D 6 E time
Examples of clades Lindblad-Toh et al., Nature 438: 803 (2005), fig. 10
Tree roots The root of a phylogenetic tree represents the common ancestor of the sequences. Some trees are unrooted, and thus do not specify the common ancestor. A tree can be rooted using an outgroup (that is, a taxon known to be distantly related from all other OTUs).
Tree nomenclature: roots past 9 1 5 7 8 6 7 8 2 3 present 4 2 6 4 5 3 1 Rooted tree (specifies evolutionary path) Unrooted tree
Tree nomenclature: outgroup rooting past root 9 10 7 8 7 9 6 8 2 3 2 3 4 present 4 6 Outgroup (used to place the root) 5 1 5 1 Rooted tree
Numbers of possible trees extremely large for >10 sequences Number Number of Number of of OTUs rooted trees unrooted trees 2 1 1 3 3 1 4 15 3 5 105 15 10 34,459,425 105 20 8 x 10²¹ 2 x 10²⁰
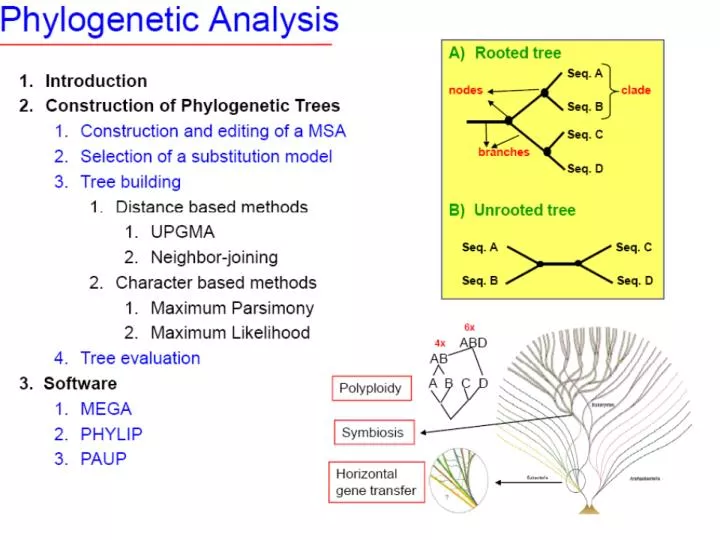
Five stages of phylogenetic analysis [1] Selection of sequences for analysis [2] Multiple sequence alignment [3] Selection of a substitution model [4] Tree building [5] Tree evaluation
Stage 1: Use of DNA, RNA, or protein For phylogeny, DNA can be more informative. --The protein-coding portion of DNA has synonymous and nonsynonymous substitutions. Thus, some DNA changes do not have corresponding protein changes.
Stage 1: Use of DNA, RNA, or protein For phylogeny, DNA can be more informative. --Some substitutions in a DNA sequence alignment can be directly observed: single nucleotide substitutions, sequential substitutions, coincidental substitutions.
Substitutions in a DNA sequence alignment can be directly observed, or inferred
Stage 1: Use of DNA, RNA, or protein For phylogeny, DNA can be more informative. --Noncoding regions (such as 5’ and 3’ untranslated regions) may be analyzed using molecular phylogeny. --Pseudogenes (nonfunctional genes) are studied by molecular phylogeny --Rates of transitions and transversions can be measured. Transitions: purine (A G) or pyrimidine (C T) substitutions Transversion: purine pyrimidine
Stage 1: Use of DNA, RNA, or protein For phylogeny, protein sequences are also often used. --Proteins have 20 states (amino acids) instead of only four for DNA, so there is a stronger phylogenetic signal. Nucleotides are unordered characters: any one nucleotide can change to any other in one step. An ordered character must pass through one or more intermediate states before reaching the final state. Amino acid sequences are partially ordered character states: there is a variable number of states between the starting value and the final value.
Five stages of phylogenetic analysis [1] Selection of sequences for analysis [2] Multiple sequence alignment [3] Selection of a substitution model [4] Tree building [5] Tree evaluation
Stage 2: Multiple sequence alignment The fundamental basis of a phylogenetic tree is a multiple sequence alignment. (If there is a misalignment, or if a nonhomologous sequence is included in the alignment, it will still be possible to generate a tree.) Consider the following alignment of orthologous globins (see Fig. 3.2)
open circles: positions that distinguish myoglobins, alpha globins, beta globins 100% conserved gaps
Stage 2: Multiple sequence alignment [1] Confirm that all sequences are homologous [2] Adjust gap creation and extension penalties as needed to optimize the alignment [3] Restrict phylogenetic analysis to regions of the multiple sequence alignment for which data are available for all taxa (delete columns having incomplete data or gaps).
Five stages of phylogenetic analysis [1] Selection of sequences for analysis [2] Multiple sequence alignment [3] Selection of a substitution model [4] Tree building [5] Tree evaluation
Stage 4: Tree-building methods: distance The simplest approach to measuring distances between sequences is to align pairs of sequences, and then to count the number of differences. The degree of divergence is called the Hamming distance. For an alignment of length N with n sites at which there are differences, the degree of divergence D is: D = n / N But observed differences do not equal genetic distance! Genetic distance involves mutations that are not observed directly.
3 4 4 3 D = (- ) ln (1 – p) Stage 4: Tree-building methods: distance Jukes and Cantor (1969) proposed a corrective formula: This model describes the probability that one nucleotide will change into another. It assumes that each residue is equally likely to change into any other (i.e. the rate of transversions equals the rate of transitions). In practice, the transition is typically greater than the transversion rate.
Models of nucleotide substitution transition A G transversion transversion T C transition
Jukes and Cantor one-parameter model of nucleotide substitution (a=b) a A G a a a a T C a
Kimura model of nucleotide substitution (assumes a ≠ b) a A G b b b b T C a
3 4 4 3 D = (- ) ln (1 – p) Stage 4: Tree-building methods: distance Jukes and Cantor (1969) proposed a corrective formula:
3 4 4 3 D = (- ) ln (1 – p) Stage 4: Tree-building methods: distance Jukes and Cantor (1969) proposed a corrective formula: Consider an alignment where 3/60 aligned residues differ. The normalized Hamming distance is 3/60 = 0.05. The Jukes-Cantor correction is 3 4 4 3 D = (- ) ln (1 – 0.05) = 0.052 When 30/60 aligned residues differ, the Jukes-Cantor correction is more substantial: 3 4 4 3 D = (- ) ln (1 – 0.5) = 0.82
Each model can affect the topology and branch lengths of the tree p-distance correction
Gamma models account for unequal substitution rates across variable sites Changing this parameter does alter the topology and branch lengths of the tree…(on next slide, kangaroo globin switches clades) Frequency distribution Substitution rate
a = 0.25 a = 1 a = 5