Download

1 / 14
170 likes | 404 Views
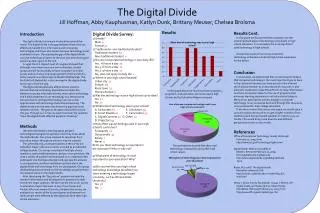
The Digital Divide. Digital Divide. The digital divide is a wide-range concept.

E N D
Digital Divide • The digital divide is a wide-range concept. • It can exist between those living in rural areas and those living in urban areas, between the educated and uneducated, between economic classes, and on a global scale between more and less industrially developed nations. There are more main factors of digital divide, which are the following: many people do not use technology because they: are not confident about their own ability to use computer skills availability of the Internet throughout the world many people who are not willing to take their time and effort to learn something new who have the skills to use the internet appropriately and those who don’t attitudes (some groups of people feel that ICT is for particular groups of people: the young, the brainy, middle class) individuals and communities don’t have access to a computer and internet services
The determinant factors of the digital divide • Interestingly, there are several factors (skill and experience, education, cost of access, institutional structure, race, ethnicity, culture, psychological factors, direct network effects, content and the speed and quality of service), that many scholars have been paying attention. • These factors confirm that digital divide research has moved beyond the technological access concept.
Methodology • The digital divide is a complex and multidimensional issue, which requires taking into account diverse technologies, variables, and territories. The first goal of our research is to measure the digital divide in Hungary and to determine the situation of Hungary among the European Union countries. For our research we used the latest ICT and socioeconomic indicators of Eurostat statistics. • At our descriptive statistics and correlation test broadband infrastructural and usage characteristics of individuals and enterprises (20 variables) and several socio-economic factors (9 variables) have been considered. The list of ICT indicators applied. • The analysis has been performed for the 28 member states of the European Union. The aim of the correlation test was the determination of economic and social factors which are or could be connected to the development of broadband networks. For the correlation calculation according to the data types of variables the Pearson’s correlation coefficient was determined, by two-tailed test. The correlation was evaluated on 0.01 and 0.05 significance level.
Results • For countries of European Union a lag behind can be detected both for accessibility and usage. There is a great difference between countries of European Union. The most significant lack is in the case of online commerce, work- and education related indicators. Taking account the infrastructural and penetration indicators, there is no big difference between the EU Member States.
Results • The broadband penetration (IND3)among enterprises is above 80% in almost all Member States, the average coverage is 90%. This is a very good result. • The deviation value of the household broadband penetration was 10,2%, which doesn’t mean a high difference among the EU countries. In case of 19 countries the penetration rate was between 61-80%, the lowest penetration was 54% (Bulgaria), the highest was 88% (Finland) in 2013. • The regular Internet use (IND4)shows a relatively high standard deviation (13.2%), but in half of the Member States more than 70% of the population are regular Internet users. The lowest value in use was 45% (Romania), the highest 93% (Luxembourg).
Results • In the case of individuals, the two e-commercial indicators (IND12)are very different. Ordering is much popular then the sales, the average values are 42% (IND12)and 15% (IND15). The highest percentage of individuals, who using the Internet for ordering goods or services is 77% in Great Britain and Denmark (IND12). • The sales activity in the private sector is the highest in the Netherlands (48%), but Slovenia, France and Great Britain have good results too, more than 30% of the individuals aged 16-74 sold online (IND15). • The average rate of users, who banking via Internet, was 44% (IND9). Using electronic banking services in the Nordic countries were widespread than in the Southern European countries.
Results • The use of mobile internet for enterprises is between 21-74% (IND13), the enterprises of Finland (74%) and Czech Republic (63%) are the most intensive users. The e-commerce sector has not been very successful, the proportion of enterprises whose income is at least 1% derived from e-business, the average is 14,5% (IND18), but the rate is less than 30% even in the best performing Member States. • The e-commerce is especially important in the Nordic countries, a quarter of enterprises have e-commercial activity and Czech Republic performs extremely well in Eastern European region. • The most recent information available (at the beginning of 2013) is that the share of NGA lines from the total fixed broadband lines is around 29% (IND8)and the share of fixed broadband lines with at least 30 Mbps is just 19% (IND7)on average. In Hungary these values are 26% and 14%, so we could follow the average level of EU.
Results • For rural regions a lag behind can be detected both for accessibility and usage. The Figure clearly shows that there is a great difference between urban and rural areas in Next Generation Network coverage. In most countries the penetration of next generation infrastructure is 35-75%, the most developed countries are Belgium (98%), Malta (99,3%) and the Netherlands (100%). • There are some countries of expressly low coverage, as Cyprus, Greece andItaly. For rural regions the average NGA coverage is 15%, 53,8% in Belgium and 100% in the Netherlands. • In Hungary the additional aids were and will be very important to reduce the differences between rural and urban regions, such as ECOP-4.4.2 or EDOP-3.1.1, and further projects in the future.
Results • To check whether socioeconomic indicators are really correlate with the network we made correlation test. At our analysis the NGA coverage, the broadband infrastructural and usage characteristics of individuals and enterprises (20 variables) and several socio-economic factors (9 variables) have been considered. The analysis has been performed for 27 Member States of the European Union. The table shows the result of the calculation.
Results • Based on our correlation calculations we made two conclusions. From infrastructural aspect a strong connection with socio-economic characteristics can be revealed mainly for broadband accessibility of households and enterprises. • This is the result of the small difference between the Member States from this point of view, on an average the 90% of the enterprises has a broadband connection. 5 factors (unemployment rate, rate of graduates from tertiary education, GDP per capita, the rate of employment and the share of agriculture in the GDP) are strictly correlated with the concerned network characteristics. • The rate of mainly urban population had no correlation with any network characteristics, furthermore the 2 NG indicators are not in correlation with any socioeconomic factors. 2 indicators (agriculture and the share of agriculture in the GDP) have negative connection with the values of network indicators. • The indicators currently have negative correlation with the indicator of the weight of agricultural sector. It is problematic, since many new applications and services connected to agriculture are available or obligatory.
Conclusion • In our opinion for Hungary there is no further lag expected for network indicators. Hungary is ranked in the middle class of Networked Readiness Index (NRI) ranking with its 44th place among 144 countries in the 2012-2013 survey (WEF). • For network indicators in most cases there is a lag of only a few percentage points with respect to the EU average. We can maintain the current path in infrastructure development in rural regions, using additional EU funds. • In relation to usage we can probably follow the average EU development in the following years. Based on our analysis we have concluded that the usage of eGovernment services is growing. • In respect of the infrastructure, the development can be considered efficient when it helps to avoid lagging, not causing an over-development because both can be significant problem. The lag behind from EU average means a competitiveness gap. At the same time, the demand of services requiring broadband network is growing gradually. According to the infrastructural indicators, development maintains the path of the previous years.