Download
1 / 30
310 likes | 561 Views
The Digital Divide. Prepared by: Les Cottrell SLAC Shahryar Khan NIIT , Akbar Mehdi NIIT http://www.slac.stanford.edu/grp/scs/net/talk07/sasia-case-apr07.ppt Presented at Quaid-e-Azam University, Pakistan . What is it?.

E N D
The Digital Divide Prepared by: LesCottrellSLAC Shahryar KhanNIIT, Akbar MehdiNIIT http://www.slac.stanford.edu/grp/scs/net/talk07/sasia-case-apr07.ppt Presented at Quaid-e-Azam University, Pakistan
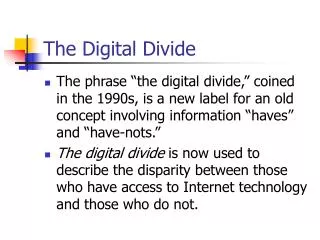
What is it? • The digital divide is a social/political issue referring to the socio-economic gap between communities that have access to computers and the Internet and those who do not. The term also refers to gaps that exist between groups regarding their ability to use ICTs (Information and Communications Technologies) effectively, due to differing levels of literacy and technical skills, as well as the gap between those groups that have access to quality, useful digital content and those that do not. • en.wikipedia.org/wiki/Digital_divide
Why does it matter: Science • Scientists cannot collaborate as equal partners unless they have connectivity to share data, results, ideas etc. • Distance education needs good communication for access to libraries, journals, educational materials, video, access to other teachers and researchers.
Why Does it Matter 4. Sep 05, international fibre to Pakistan fails for 12 days, satellite backup can only handle 25% traffic, call centres given priority. Research & Education sites cut off from Internet for 12 days • School in a secondary town in an East Coast country with networked computer lab spends 2/3rds of its annual budget to pay for the dial-up connection. • Disconnects 2. Telecentre in a country with fairly good connectivity has no connectivity • The telecentre resorts to generating revenue from photocopies, PC training, CD Roms for content. Heloise Emdon, Acacia Southern Africa UNDP Global Meeting for ICT for Development, Ottawa 10-13 July 3. Primary health care giver, somewhere in Africa, with sonar machine, digital camera and arrangement with national academic hospital and/or international health institute to assist in diagnostics. After 10 dial-up attempts, she abandons attempts to connect
How do we measure it? • PingER project • Arguably the world’s most extensive active end-to-end Internet Performance Project
PingER Methodology >ping remhost Uses ubiquitous ping Remote Host (typically a server) Monitoring host Internet 10 ping request packets each 30 mins Once a Day Ping response packets Data Repository @ SLAC Measure Round Trip Time & Loss
Architecture • Monitor hosts send 21 pings each 30 mins to Remote Hosts and cache results • Archive hosts gather data daily, save, analyze & make results available publicly via web
PingER Deployment • PingER project originally (1995) to measure network performance for US, Europe and Japanese HEP community • Extended this century to measure Digital Divide: • Collaboration with ICTP Science Dissemination Unit http://sdu.ictp.it • ICFA/SCIC: http://icfa-scic.web.cern.ch/ICFA-SCIC/ • >120 countries (99% world’s connected population) • >30 monitor sites in 14 countries • Monitor 44 sites in S. Asia
World Measurements: Min RTT from US • Maps show increased coverage • Min RTT indicates best possible, i.e. no queuing • >600ms probably geo-stationary satellite • Between developed regions min-RTT dominated by distance • Little improvement possible • Only a few places still using satellite for international access, mainly Africa & Central Asia 2000 2006
Effect of Losses • Losses critical, cause multi-second timeouts • Typically depend on a bad link, so ~distance independent • > 4-6% video-conf irritating, non-native language speakers unable to communicate • > 4-5% irritating for interactive telnet, X windows • >2.5% VoIP annoying every 30 seconds or so • Burst losses of > 1% slightly annoying for VoIP
Losses from SLAC to world • # hosts monitored increased seven-fold • Increase in fraction with good loss • Despite adding more hosts in developing world >=12% >=5% <12% >=2.5% < 5% >=1% < 2.5% < 1%
Loss Improvement by Population • Loss by country weighted by population of country
Unreachability • All pings of a set fail ≡unreachable • Shows fragility, ~ distance independent • Developed regions US, Canada, Europe, Oceania, E Asia lead • Factor of 10 improvement in 8 years • Africa, S. Asia followed by M East & L. America worst off • Africa NOT improving SE Asia L America M East C Asia Oceania S Asia SE Europe Russia Developing Regions Africa E Asia Developed Regions US & Canada Europe
World thruput seen from US Throughput ~ 1460Bytes / (RTT*sqrt(loss)) (Mathis et al) Behind Europe 6 Yrs: Russia, Latin America 7 Yrs: Mid-East, SE Asia 10 Yrs: South Asia 11 Yrs: Cent. Asia 12 Yrs: Africa South Asia, Central Asia, and Africa are in Danger of Falling Even Farther Behind
Normalized for Details • Note step changes • Africa v. poor • S. Asia improving • N. America, Europe, E Asia, Oceania lead
Costs compared to West • Sites in many countries have bandwidth< US residence • “10 Meg is Here”, www.lightreading.com/document.asp?doc_id=104415 • Africa: $5460/Mbps/m • W Africa $8K/Mbps/m • N Africa $520/Mbps/m • Often cross-country cost dominates cf. international 1 yr of Internet access > average annual income of most Africans, Survey by Paul Budde Communnications
Overall (Aug 06) • ~ Sorted by Average throughput • Within region performance better (black ellipses) • Europe, N. America, E. Asia generally good • M. East, Oceania, S.E. Asia, L. America acceptable • C. Asia, S. Asia poor, Africa bad (>100 times worse) Monitored Country
UNDP Human Development Index (HDI) • A long and healthy life, as measured by life expectancy at birth • Knowledge, as measured by the adult literacy rate (with two-thirds weight) and the combined primary, secondary and tertiary gross enrolment ratio (with one-third weight) • A decent standard of living, as measured by GDP per capita. Africa PingER - Strong Correlation - Non subjective - Quicker / easier to update
Med. & Africa vs HDI • N. Africa has 10 times poorer performance than Europe • Croatia has 13 times better performance than Albania • Israel has 8 times better performance than rest of M East Med. Countries • E. Africa poor, limited by satellite access • W. Africa big differences, some (Senegal) can afford SAT3 fibre others use satellite • Great diversity between & within regions
South Asia • Population
S Asia Bandwidth & Internet use • Note Log scale for BW • India region leader • Pakistan leads bw/pop • Nepal very poor • Pakistan leads % users • Sri Lanka leads hosts%% • Pakistan leads bw/pop • Nepal, Bangladesh, Afghanistan very poor
S Asia PingER Coverage Min-RTT from CERN • Monitor 44 sites in region. • 6 Monitoring hosts (3 ea in India & Pakistan) Loss from CERN
Derived thruput • Divides into 2 • India, Maldives, Pakistan, Sri Lanka • Bangladesh, Nepal, Bhutan, Afghanistan • Weekend vs. weekday indicates heavy congestion
Digital Access Index (DAI): Infrastructure availability, Affordability of access, Education, Quality of ICT, & Internet usage Europe, E Asia (except China), Oceania top right Israel & Singapore with top group Middle East in middle, Iran poorest Africa bottom left S. Asia split: Bhutan, Nepal, Bangladesh with Africa India, Pak, Sri Lanka better Strong positive linear correlation, C Asia
Challenges: Finding Hosts • Best via contacts • Also use Google to provide hosts for country (eg .ly) • Found 844 hosts => 702 unique names => 600 ping • 88 unique IP addresses • 6 in Libya according to Geo IP Tool www.geoiptool.com/ • Automated by Akbar Mehdi of NIIT at SLAC (see https://confluence.slac.stanford.edu/display/IEPM/PingER+Host+Searcher ) • Verified with TULIP geolocator • Locates hosts using RTT from multiple landmarks to target • Also see Octant for US www.cs.cornell.edu/~bwong/octant/
TULIP geolocator (Faran) • www.slac.stanford.edu/comp/net/wan-mon/tulip/ • Java applet (needs Java Webstart) • Friendly client, easy vizualization • Need landmarks around world Enter target Pings min/avg/max from landmarks to targets Landmarks Target Traceroutes from landmarks to targets
Conclusions • Last mile problems, and network fragility • Decreasing use of satellites, expensive, but still needed for many remote countries in Africa and C. Asia • Africa ~ 10 years behind and falling further behind, leads to “information famine” • E. Africa factor of 100 behind Europe • EASSy project will bring fibre to E. Africa, hopefully better access than SAT3 • Africa big target of opportunity • Growth in # users 2000-2005 200%, Africa 625% • Need more competitive pricing • Fibre competition, government divest for access, low cost VSAT licenses • Consortiums to aggregate & get better pricing ($/BW reduces with BW) • Need better routing - IXPs • Need training & skills for optimal bandwidth management • Internet performance correlates strongly with UNDP & ITU development indices • Increase coverage of monitoring to understand Internet performance
More information/Questions • Acknowledgements: • Harvey Newman and ICFA/SCIC for a raison d’etre, ICTP for contacts and education on Africa, Mike Jensen for Africa information, NIIT/Pakistan for developing valuable tools, Maxim Grigoriev (FNAL), Warren Matthews (GATech) for ongoing code development for PingER, USAID MoST/Pakistan for development funding, SLAC for support for ongoing management/operations support of PingER • PingER • www-iepm.slac.stanford.edu/pinger, sdu.ictp.it/pinger/africa.html • Human Development • http://www.gapminder.org/ • Case Studies: • https://confluence.slac.stanford.edu/display/IEPM/Sub-Sahara+Case+Study • http://sdu.ictp.it/lowbandwidth/program/case-studies/index.html
Why does it matter: Business Traditional MNC Business Model >$20K per year 75 to 100 million people Some MNCs >$1,500 - 20K per year 1.5 to 1.75 billion people Local Firms Future Opportunity? <$1,500 per year 4 billion people • G8 specifically pledged support for African higher education and research by “Helping develop skilled professionals for Africa's private and public sectors, through supporting networks of excellence between African's and other countries' institutions of higher education and centres of excellence in science and technology institutions” G8 specifically pledged support for African higher education and research by “Helping develop skilled professionals for Africa's private and public sectors, through supporting networks of excellence between African's and other countries' institutions of higher education and centres of excellence in science and technology institutions” Prahalad and Hart • Saturating western markets • High growth IT markets: BRIC • NOT business as usual • New business models • Distinct needs • Dearth of distribution channels Karen Coppock RDVP, Stanford