Download
1 / 59
590 likes | 693 Views
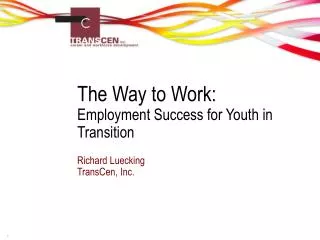
The Five W’s and How of Results-Based Accountability™ Social Outcomes Measurement Conference Sydney, AU. Adam Luecking Results Leadership Group www.resultsleadership.org. MEASURABLE RESULTS FOR CLIENTS AND COMMUNITIES. Agenda. Results-Based Accountability:.

E N D
The Five W’s and How ofResults-Based Accountability™ Social Outcomes Measurement ConferenceSydney, AU Adam Luecking Results Leadership Group www.resultsleadership.org MEASURABLE RESULTSFOR CLIENTS AND COMMUNITIES
Agenda • Results-Based Accountability: Who, what, when, where, why & how? • Questions and Answers
Why RBA To implement the 5 conditions of Collective Impact • Common language • Shared measurement systems • Mutually reinforcing activities • Continuous communication • Backbone support organization
Why RBA To create Measurable Impact Measurable Impact akaTurning the Curve
Why RBA To know you are making a difference
Why RBA To bring precision to your passion How much did we do? Is anyone better off? How well did we do it?
How RBA? • Introduction to core concepts • Population Accountability • Performance Accountability • Turn the Curve Thinking • Tie it all Together
Two Key Principles for Achieving Measurable Impact 1. Starting with ends, working backwards to means 2. Data-driven, transparent Decision Making
2 - Kinds of Accountability RBA in a Nutshell 2-3-7 • Population accountability • Performance accountability 3 - Kinds of Performance Measures. • How much did we do? • How well did we do it? • Is anyone better off? 7 - Questions from ends to means in less than an hour (aka. Turn the Curve Thinking)
about the well-being ofWHOLE POPULATIONS about the well-being ofCLIENT POPULATIONS Results-Based Accountabilityis made up of two parts: Population Accountability For Communities – Cities – Counties – States - Nations Performance Accountability For Programs – Agencies – and Service Systems MEASURABLE RESULTSFOR CLIENTS AND COMMUNITIES
MEASURABLE RESULTSFOR CLIENTS AND COMMUNITIES [ ] DEFINITIONS Language Discipline RESULT A condition of well-being for children, adults, families or communities. Children succeeding in school, Safe communities, Clean environment POPULATION ACCOUNTABILITY INDICATOR A measure which helps quantify the achievement of a result. Rate of high school graduation, Crime rate, Air quality index PERFORMANCE MEASURE A measure of how well a program, agency or service system is working. PERFORMANCE ACCOUNTABILITY Three types: 1. How much did we do? 2. How well did we do it? 3. Is anyone better off?
MEASURABLE RESULTSFOR CLIENTS AND COMMUNITIES Why Distinguish Population from Performance Accountability? A question of RESULT & INDICATORS ENDS A STRATEGY & PERFORMANCE MEASURES versus MEANS Customer result Ends Means Service delivery
MEASURABLE RESULTSFOR CLIENTS AND COMMUNITIES Children Live in Safe And Stable Homes END • Doing the • right things? Indicator Comprehensive Strategy/Partners Interagency System Program A 2. Doing those things right? MEANS Agency/Program Performance Measures Interagency Service System Performance Measures
MEASURABLE RESULTSFOR CLIENTS AND COMMUNITIES Population Accountability
MEASURABLE RESULTSFOR CLIENTS AND COMMUNITIES Population + Geographic Area + Condition of Well Being = Result
MEASURABLE RESULTSFOR CLIENTS AND COMMUNITIES Populations? All people in Sydney All Australians All children prenatal to 5 years old People with developmental disabilities People that enjoy water sports
MEASURABLE RESULTSFOR CLIENTS AND COMMUNITIES Geographic Area? Australia New South Wales Sydney Glebe
MEASURABLE RESULTSFOR CLIENTS AND COMMUNITIES Conditions of Well Being? Healthy Safe Living with Dignity Economically Secure Succeeding in School
MEASURABLE RESULTSFOR CLIENTS AND COMMUNITIES Selecting Indicators
MEASURABLE RESULTSFOR CLIENTS AND COMMUNITIES Criteria forSelecting Indicators • Communication Power Does the indicator communicate to a broad range of audiences? • Proxy Power Does the indicator say something of central importance about the result? Does the indicator bring along the data HERD? • Data Power Quality data available on a timely basis.
MEASURABLE RESULTSFOR CLIENTS AND COMMUNITIES Choosing IndicatorsWorksheet Result_______________________ ProxyPower DataPower CommunicationPower Candidate Indicators Measure 1 Measure 2 Measure 3 Measure 4 Measure 5 Measure 6 Measure 7 Measure 8 H M L H M L H M L H H H H L H DataDevelopmentAgenda
MEASURABLE RESULTSFOR CLIENTS AND COMMUNITIES Performance Accountability
MEASURABLE RESULTSFOR CLIENTS AND COMMUNITIES Selecting Performance Measures
MEASURABLE RESULTSFOR CLIENTS AND COMMUNITIES The Three Kinds of Program Performance Measures Quality Quantity RBA Guide Page 7 How welldid we do it? How much did we do? Effect Effort Is anyonebetter off? # %
MEASURABLE RESULTSFOR CLIENTS AND COMMUNITIES Selecting Headline Performance Measures How much did we do? # Clients/customers served # Activities (by type of activity)
MEASURABLE RESULTSFOR CLIENTS AND COMMUNITIES Selecting Headline Performance Measures How well did we do it? % Common measures e.g. workload ratio, staff turnover rate, % staff fully trained, unit cost % Activity-specific measures e.g. % timely intakes, % accreditation standards met How much did we do?
MEASURABLE RESULTSFOR CLIENTS AND COMMUNITIES Selecting Headline Performance Measures How much did we do? How well did we do it? Is anyone better off? #/% Skills / Knowledge(e.g. cognitive, social, physical) #/% Attitude(e.g. toward language, parenting) #/% Behavior(e.g. reading to child at home) #/% Circumstances (e.g. child care, transportation)
#childrenfullyimmunized %childrenfullyimmunized MEASURABLE RESULTSFOR CLIENTS AND COMMUNITIES Health Plan or Practice Quality Quantity How well did we do it? How much did we do? Percent ofpatients treatedin less than1 hour Number ofpatientstreated Effect Effort Is anyone better off?
MEASURABLE RESULTSFOR CLIENTS AND COMMUNITIES Education Quality Quantity How well did we do it? How much did we do? Student-teacherratio Number ofstudents Effect Effort Is anyone better off? Number ofhigh schoolgraduates Percent ofhigh schoolgraduates
MEASURABLE RESULTSFOR CLIENTS AND COMMUNITIES Fire Department Quality Quantity How well did we do it? How much did we do? ResponseTime Number ofresponses Effect Effort Is anyone better off? Number of firerelated deaths(in catchment) Rate offire deathsper 100,000
MEASURABLE RESULTSFOR CLIENTS AND COMMUNITIES Not All Performance Measures Are Created Equal Quality Quantity How well did we do it? How much did we do? Least LeastImportant 2nd MostImportant Effect Effort Is anyone better off? MostImportant Most 3rd MostImportant
MEASURABLE RESULTSFOR CLIENTS AND COMMUNITIES The Matter of Control Quality Quantity How well did we do it? How much did we do? MostControl Effect Effort Is anyone better off? LeastControl PARTNERSHIPS
MEASURABLE RESULTSFOR CLIENTS AND COMMUNITIES Turn the Curve Thinking™
MEASURABLE RESULTSFOR CLIENTS AND COMMUNITIES Turn-the-Curve Thinking™: Talk to Action Result or Program: How are we doing? Data Baseline Why? Story behind the baseline Partners(with a role to play in turning the curve) Help? What Works Options? Propose to do? Strategy (w/ Budget)
MEASURABLE RESULTSFOR CLIENTS AND COMMUNITIES Turn-the-Curve Thinking™ Talk to Action Result or Program:____________ How are we doing? Data Baseline
MEASURABLE RESULTSFOR CLIENTS AND COMMUNITIES The Matter of Baselines OK? Return* on Investment Turning the Curve Forecast History Baselines have two parts: history and forecast * The “ROI” is not financial, it is Results
MEASURABLE RESULTSFOR CLIENTS AND COMMUNITIES Turn-the-Curve Thinking™: Talk to Action Result or Program:_____________ Data Baseline Story behind the baseline Why? Research Agenda
MEASURABLE RESULTSFOR CLIENTS AND COMMUNITIES Force Field Analysis Factors Restricting? Factors Contributing?
MEASURABLE RESULTSFOR CLIENTS AND COMMUNITIES The Story Behind the Baseline • Root Causes (ask “Why?” five times) • Positive and negative • Prioritize – which are the most important to address to “turn the curve” of the baseline? • Research agenda?
MEASURABLE RESULTSFOR CLIENTS AND COMMUNITIES Turn-the-Curve Thinking™ Talk to Action Result or Program:_____________ Data Baseline Story behind the baseline Research Agenda Help? Partners(with a role to play in turning the curve)
MEASURABLE RESULTSFOR CLIENTS AND COMMUNITIES • Partners • Who are partners who may have a role to play in turning the curve? • Does the story behind the curve suggest any new partners?
MEASURABLE RESULTSFOR CLIENTS AND COMMUNITIES Turn-the-Curve Thinking™: Talk to Action Result or Program:______________ Data Baseline Story behind the baseline Research Agenda Partners(with a role to play in turning the curve) What Works Options? Research Agenda
MEASURABLE RESULTSFOR CLIENTS AND COMMUNITIES What Works • Options for actions to “turn the curve”? • Research-based? • Low-cost/no-cost? • Off-the-wall ideas? • Research agenda?
MEASURABLE RESULTSFOR CLIENTS AND COMMUNITIES Turn-the-Curve Thinking™: Talk to Action Result or Program: _______________ Data Baseline Story behind the baseline Research Agenda Partners(with a role to play in turning the curve) What Works Research Agenda Criteria: Leverage; Feasible; Specific; Values Propose to do? Strategy