Download
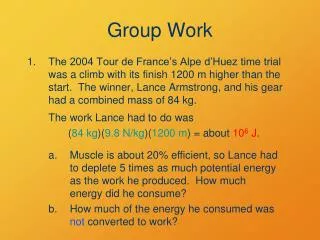
1 / 4
40 likes | 130 Views
Group work results. Group 2: participants from Norway, Finland, Lithuania, Italy. Indicators. Technical Basic measures: e.g. Workstations Also: Level of virtualization in workstations, Financial Mandatory Dangerous to measure the costs only Indicators for measuring the outcomes

E N D
Group work results Group 2: participants from Norway, Finland, Lithuania, Italy
Indicators • Technical • Basic measures: e.g. Workstations • Also: Level of virtualization in workstations, • Financial • Mandatory • Dangerous to measure the costs only • Indicators for measuring the outcomes • Efficiency of learning and research: amount of e-learning, number of published data sets • Hot topics for universities • E.g. digital exams are hot right now • How much a LMS is improving efficiency • Improving visibility to license costs • HR: salary levels against the private sector, turnover figure
Why are we doing this • Main goal: to make universities more efficient and effective • Knowing your own data, especially in the distributed part of IT • Selling the selected ITapproach to the rector (e.g. what is the right cost level, what are the right services) • Understanding what others are doing: finding the differences • Partnership opportunities: what tools others are using • Related questions: • How do you convince universities to show their data to others • What tangible improvements have been implemented through benchmarking
The process • The process needs to be fast enough to accommodate emerging new needs (recent example: digital exams) • The result: continuous process: new indicators coming in every year, old ones being dropped out • Requirements fall into three categories • There is a need for core data (exchangeable across countries and stable over time) • There is a need for a customized part for every country • There is a need for an agile approach • Several layers for co-operations • Central tool to be used by all for automating the basic work (e.g. kTI) • Each country to implement its own additional elements (with/without the tool) • European level: EUNIS on a voluntary basis • Chance to meet on a yearly basis • Possibility to transform the work into a European project