Download
1 / 28
280 likes | 391 Views
Lecture 3. Terrestrial Biogeochemical Cycling and Climate Elena Shevliakova & Chip Levy. UNITS. 1 Tg = 1 Terragram = 10 12 grams 1Mt = 1 Megaton = 10 6 tons = 10 9 kilograms = 10 12 grams 1 Pg = 1 Pedagram = 10 15 grams 1 Gt = 1 Gigaton = 10 9 tons = 10 12 kilograms = 10 15 grams.

E N D
Lecture 3. Terrestrial Biogeochemical Cycling and ClimateElena Shevliakova & Chip Levy
UNITS 1 Tg = 1 Terragram = 1012 grams 1Mt = 1 Megaton = 106 tons = 109 kilograms = 1012 grams 1 Pg = 1 Pedagram = 1015 grams 1 Gt = 1 Gigaton = 109tons = 1012 kilograms = 1015 grams
Generalized scope of interactions GB Bonan 2002, Ecological Climatology
Major Biogeochemical Cycles • Nitrogen • Phosphorous • Carbon
Nitrogen Cycling ? fertilizer combustion fertilizer
Human Impact on the Nitrogen Cycle • Roughly 90% of nitrogen was recycled every year in pre-industrial times. Losses were historically made up by natural nitrogen fixation [~100TgN/yr] • Humans now at least double these historic inputs by combustion and adding fertilizer [100-200 TgN/yr]. Many land ecosystems now leak nitrogen. • Is the global Nitrogen cycle in Balance?
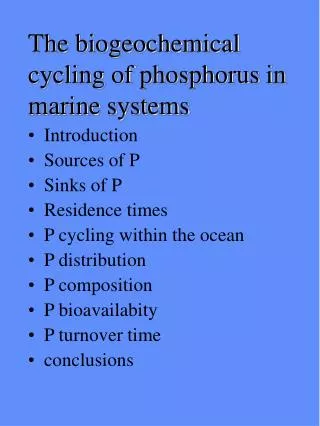
Phosphorus Cycle The phosphorus cycle is “simple” because it does not involve the atmosphere. Phosphate from rock dissolves very slowly (unless we intervene. The dissolved phosphate is used by plants, which may pass it to animals. Some of the phosphate is excreted by animals and goes immediately into the dissolved pool. When plants or animals die, phosphate is released by bacteria decomposition of organic compounds (like nucleic acids). Large quantities of dissolved phosphate are carried into the sea by runoff. The formation of new rocks from marine sediments, where the phosphorus eventually comes to rest, is very slow. However, it is unlikely that we will soon run out of phosphate rock - the known reserves are large. Nevertheless, supplies in soils are readily depleted, so phosphorus is often a limiting nutrient.
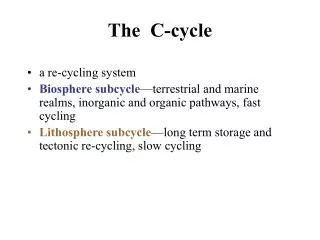
Carbon Cycle and Greenhouse Warming Although photosynthesis and respiration used to be in balance globally, fossil fuel combustion (roughly 10% of NPP) now means that emissions of CO2 exceed surface uptake.
1 ppm(v) = 2.1 Gt(C)This connects the world’s environmental science and energy. For Example: Assuming fossil fuel combustion adds carbon to the atmosphere as CO2, 6.3 Gt of carbon is 3 CO2 molecules extra added to every 106 molecules of air or 3 more ppmv of CO2. [Bad News]We are now transferring between 6 and 7 Gt(C) per year from below ground to the atmosphere, but the increase seen is about 1.5 ppmv per year. We conclude that the combined net rate of transfer of carbon outof atmospheric to terrestrial and ocean sinks is currently about half the rate of carbon transfer intothe atmosphere from fossil fuels. [Good News, for now]
Carbon cycle - AR4 IPCC update 2 • Atmospheric carbon dioxide (CO2) concentration has continued to increase and is now almost 100 ppm above its pre-industrial level. • The annual mean CO2 growth rate • in the 1990s : 3.2 ± 0.1 GtC/ yr • 2000 to 2005 : 4.1 ± 0.1 GtC /yr • Annual emissions of CO2 from fossil fuel burning and cement production • in the 1990s: 6.4 ± 0.4 GtC /yr • 2000 to 2005 : 7.2 ± 0.3 GtC /yr X (7.2/6.4) = 4.1/3.2 X >1.0 means ? Is this good or bad?
Atmosphere: 75 stations Ocean: 67484 observations
Carbon cycle - AR4 IPCC update 1 • About 50% of a CO2 increase will be removed from the atmosphere within 30 years • Further 30% will be removed within a few centuries. • The remaining 20% may stay in the atmosphere for many thousands of years.
Estimated carbon sources and sinks during the decade of 1990’s (Pg C yr-1) Well known sources Fossil fuel emissions 6.3 + 0.4 Where CO2 has been observed Remains in atmosphere 3.2 + 0.1 Dissolved in ocean 2.1 + 0.2 Residual CO2 Net terrestrial uptake (inferred) 1.0 + 0.4
What could cause a large terrestrial sink? • CO2 Fertilization • Land Use • Climate Change
Forest Inventories offer mixed evidence on CO2 fertilization. • ~ 30,000,000 trees in the US show no increase in growth over the past several decades • ~60,000 trees across the Amazon (Lewis 2006) show primary forest carbon increasing at 0.5 tC/ha, enough for a 1Pg/yr sink if pan-tropical • But, the tropical sink would have increased by 2% per year from the 80’s to the 90’s – 20X too fast for CO2 fertilization (we need an attribution study).
Inventories show a big temperate sink caused by land use change. Northern Forest Sink = 0.7 GTC y –1 Goodale et. al. (2002)
Carbon Cycle: Summary • Net land flux = 1 PgC/y that fluctuates from 0 to 5 PgC/y primarily because of fire. • Tropical deforestation source = 0.5-2.0 PgC/y. • This implies a land sink = 1.5-3.0 PgC/y. • Temperate land use sink = 0.5-1.5 PgC/y. • Thus, the data are consistent with a CO2 fertilization as small as 0.0 and as large as that implied by models (~ 2 PgC/y). • Evidence of CO2 fertilization from experiments and inventories is equivocal [maybe yes, maybe no]. • Response of both land and ocean to increased atmospheric CO2 is a critical question. Why?
Although a net missing sink of 1.0 + 0.4 sounds pretty good, uncertain land use compromises our ability to predict the future of the sink: 1. Tropical deforestation (a big source). 2. Temperate land use change (a big sink). Missing Sink = Residual Net Flux +Tropical Deforestation Source – Temperate Land Use Sink
Cause = nitrogen limitation? Annual tree basal area increment (standardized by pre-treatment mean) Korner et al. 2005