Download
1 / 41
430 likes | 685 Views
The 2 nd WCRP CORDEX Science and Training Workshop 27-30,August 2013. Terrestrial Ecosystem Carbon and Climate Change Devaraju N Indian Institute of Science, Bangalore, India dev@caos.iisc.ernet.in. Outline. Interactions between terrestrial ecosystem carbon and climate

E N D
The 2nd WCRP CORDEX Science and Training Workshop 27-30,August 2013 Terrestrial Ecosystem Carbon and Climate Change DevarajuN Indian Institute of Science, Bangalore, India dev@caos.iisc.ernet.in
Outline • Interactions between terrestrial ecosystem carbon • and climate • Introduction to DATA Analysis using CDAT
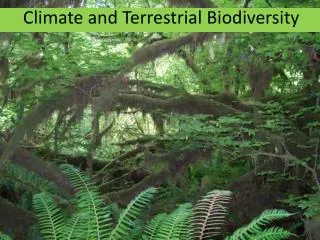
Vegetation <--> Atmosphere interactions Different Climate States ?
Deforestation Vegetation
Literature Brovkin et al 2003 found one steady state in northern high latitudes (abrupt vegetation change due to delayed response) Bistable steady states found in Amazon(drier) by Oyama and Nobre 2003 (environmental degradation) Kleidon et al 2007 claim that the occurrence of multiple steady states could be a model artifact
Devaraju et. al. 2011 Also found an absence of multiple states 0.35mm/day 3K
Uncertainties in Multiple Climate States Due to Interactions between the systems * Carbon cycle * Carbon-Nitrogen Cycle interactions (CLM4-CN) * Carbon-Nitrogen-Phosphorous Cycle
Example CLM4-C CLM4CN
CLM4CN Results (Bonan and Levis 2010, GRL) The C and CNdep carbon budgets for 1973-2004 are consistent with earlier studies. In the carbon-only simulation 32 year mean Land use emission 1.8PgCyr-1 Land sink 2.5PgCyr-1 In the CN deposition simulation 32 year mean Land use emission 1.8PgCyr-1 Land sink 1.8PgCyr-1
The uptake and release of the carbon through the • process of photosynthesis and • respiration plays a significant role in determining • the fraction of anthropogenic CO2 that stays in the • atmosphere and changes in climate. • In order to improve our understanding of the • historical changes and predict future trends in • ecosystems: • We must improve our understanding of individual • ecosystem processes and their interactions.
CLM4 N-deposition 0.12 gN/m2 (~20 Tg-N/yr) • Galloway et. al. 2004,2008 says • Humans have more than doubled • the rate at which nitrogen enters the • terrestrial biosphere • Agricultural land expansion, • Fossil fuel burning and • Fertilization application 0.43 gN/m2 (~73.1 Tg-N/yr) • Thus, Earth’s vegetation cover affects significantly • Alter regional and global climate through • changes in the global carbon and nitrogen cycles • To date, very few global scale studies exist • on the impact of elevated nitrogen deposition • on terrestrial ecosystem
Spatial pattern of Total inorganic N deposition. (Source: Lelieveld and Dentener 2000; Galloway et al 2004)
Carbon is the basis of life on Earth Stocks in blue in Peta grams (PgC) Fluxes in red (PgC/year)
If all sources are equal to all sinks, the carbon cycle can be said to be in equilibrium (or in balance) However, because fossil fuel combustion and deforestation have changed the terrestrial stocks Increasing the CO2 inputs to the atmosphere, these activities have caused the size of the atmospheric carbon pool to increase and is believed to cause the observed trend of increasing global temperatures.
Missing Sink (Esser et al 2011) Fossi fuel emission 343 PgC LULCC 156 PgC Total 499 (since pre-industrial) In the atmosphere 216 PgC Uptake ocean 118 PgC Total 334 PgC Difference (499 -334) = 165 PgC (missing sink)
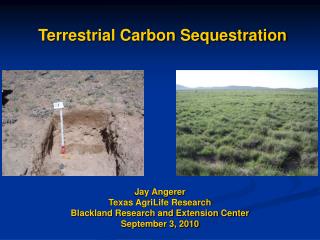
The major reservoirs of terrestrial carbon are: Total Vegetation Carbon (TOTVEGC) whichas the name suggests is the carbon stored in plants or biomass and accounts for about 560 PgCstored Soil Carbon (SOILC) is the largest pool of terrestrial carbon (1500 PgC) The few variables which describes the Carbon cycle in the modeels Stocks:Terrestrial ecosystem carbon
FLUXES (gC/m^2/s) C is exchanged naturally between the terrestrial systems and the atmosphere mainly through photosynthesis and respiration Some of the flux related terms are : Autotrophic Respiration: respiration processes by living plant parts Heterotrophic respiration: respiration processes by microbes in soil and litter Net Primary Productivity (NPP) is the difference between photosynthesis and plant respiration Net Ecosystem Exchange (NEE) is the net carbon movement between an ecosystem and the atmosphere
Model Description for CLM4 of NCAR (Community Land Model version4) The CLM4 examines the physical, chemical, and biological processes of terrestrial ecosystem and demonstrates the importance of climate in determining vegetation compositions and the feedback. http://www.cesm.ucar.edu/models/ccsm4.0/clm/models/lnd/clm/doc/UsersGuide/f63.html 1000-year experiments (Net ecosystem exchange is nearly zero by 900) A horizontal resolution of 1.9° latitude and 2.5° longitude is used. A 57-year (1948–2004) observational atmospheric forcing dataset is used to drive the model. CTL (Pre-industrial N-deposition) CTL2K CTL2xCO2 4N
DATA Global CLM4 simulations with 2 deg resolution CTL, 4Ndep, 2Kwatming, 2xco2 Compute NPP, SOILC, VEGC and TOTECO SYSC due to N deposition, CO2 increase, Warming Global CAM5 simulations with 2 deg resolution CTL, LCC Compute the Change in Temperature & Precipitation due to Land cover change.
OUT PUT DATA FORMAT of CLM4 and CAM5 • NetCDF (Network Common Data Format) • Create • Edit • Modify Variables
Tools For spatial plots CDAT (NCL, Matlab, ferret etc..) OS:Linux It is a collection of python modules Scripting is python (.py) Visualization is also possible for quick check of the data: VCDAT
CO2 fertilization Climate Warming N- deposition 236 Gt-C is taken up by terrestrial ecosystem 175 Gt-C is taken up by terrestrial ecosystem 152 Gt-C is lost by terrestrial ecosystem
EXAMPLE SCRIPTS using CDAT # Import modules: # cdms - Climate Data Management system accesses gridded data. # vcs - Visualization and control System 1D and 2D plotting routines. # os - Operation System routines for Mac, DOS, NT, or Posix depending on the # system you're on. # sys - This module provides access to some objects used or maintained by #the interpreter and to functions that interact strongly with the interpreter. import cdms, vcs, os, sys # Open data file: filepath = os.path.join(sys.prefix, 'sample_data/clt.nc') cdmsfile = cdms.open( filepath ) cdmsfile.listvariables() data = cdmsfile('clt') # Initial VCS: v = vcs.init() # Plot data using the default boxfill graphics method: v.plot( data )
# Plot data using the isoline graphics method: v.clear() v.isoline( data )
# Extract a 3 dimensional dataset filepath = os.path.join(sys.prefix,'/CLM4/Ncfiles/neenepnppgpp_4ndep.nc') cdmsfile = cdms.open( filepath ) data = cdmsfile('NPP') # Average over time and longitude to get a variable # with latitude and level axes d2 = cdutil.averager(data, axis='tx') d2.id = 'NPP_zonal' # Plot results v.clear() v.plot( d2 )
For time series plot # Extract a 3 dimensional dataset filepath = os.path.join(sys.prefix,'/CLM4/Ncfiles/neenepnppgpp_4ndep.nc') cdmsfile = cdms.open( filepath ) data = cdmsfile('NPP') # Average over time and longitude to get a variable # with latitude and level axes d2 = cdutil.averager(data, axis=‘xy') d2.id = 'NPP_timeseries' # Plot results v.clear() v.YxvsxX (d2 )
Program to plot/compute for a specific region: # Extract a 3 dimensional dataset filepath = os.path.join(sys.prefix,'/CLM4/Ncfiles/neenepnppgpp_4ndep.nc') cdmsfile = cdms.open( filepath ) data = cdmsfile('NPP‘, latitude=(5,38), longitude=(68, 99)) # Average over time and longitude to get a variable # with latitude and level axes d2 = cdutil.averager(data, axis='tx') d2.id = 'NPP_zonal' # Plot results v.clear() v.plot( d2 )
Program to plot/compute for a specific time: # Extract a 3 dimensional dataset filepath = os.path.join(sys.prefix,'/CLM4/Ncfiles/neenepnppgpp_4ndep.nc') cdmsfile = cdms.open( filepath ) data = cdmsfile('NPP‘, time=(‘0001-01-01’,0005-01-01)) # Average over time and longitude to get a variable # with latitude and level axes d2 = cdutil.averager(data, axis='tx') d2.id = 'NPP_zonal' # Plot results v.clear() v.plot( d2 )
Program to plot/compute for SEASONS: # Extract a 3 dimensional dataset filepath = os.path.join(sys.prefix,'/CLM4/Ncfiles/neenepnppgpp_4ndep.nc') cdmsfile = cdms.open( filepath ) data = cdmsfile('NPP‘) # Average over time and longitude to get a variable # with latitude and level axes d2 = cdutil.DJF(data) #JJA, or you can define your own seasons d2.id = 'NPP_zonal‘ # Plot results v.clear() v.plot( d2 )
Now Calculate How much ecosystem carbon is stored in South Asia? Calculate the effect of historical warming on South Asian Total ecosystem carbon? Calculate the effect of historical CO2 increase on South Asian Total ecosystem carbon? Calculate the effect of historical N deposition increase on South Asian Total ecosystem carbon? From CAM5 simulations Calculate the effect of one million km^2 deforestation on Temperature and Precipitation for the South Asian region.
THANK YOU for your attention ?
Scientific Questions For The Earth System Model • How will climate interactions with the Land Model influence CO2 levels in the atmosphere over the short term? • How will land use interactions with the Land Model influence CO2 levels in the atmosphere over the short term? • What role will CO2 fertilization play in controlling CO2 levels? • Will ocean biogeochemistry control the long-tem level of CO2 in the atmosphere and what will it be? • Two longer-term land wild cards: soil C release in a warmer Arctic; CH4 release in a warmer Arctic