Download
1 / 31
310 likes | 422 Views
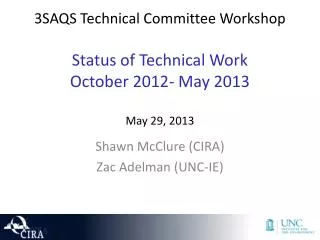
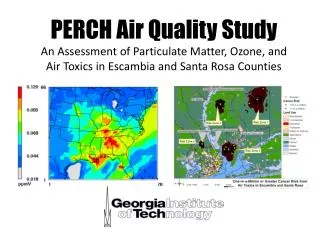
Three-State Air Quality Study (3SAQS) Three-State Data Warehouse (3SDW). 2008 CAMx Modeling Model Performance Evaluation Summary University of North Carolina (UNC-IE) Cooperative Institute for Research in the Atmosphere (CIRA) ENVIRON International Corporation (ENVIRON ) June 19, 2014.

E N D
Three-State Air Quality Study (3SAQS)Three-State Data Warehouse (3SDW) 2008 CAMx Modeling Model Performance Evaluation Summary University of North Carolina (UNC-IE) Cooperative Institute for Research in the Atmosphere (CIRA) ENVIRON International Corporation (ENVIRON) June 19, 2014
Background • Objective: Develop a 2008 base year air quality modeling platform for use in NEPA analyses for oil and gas development projects in CO, UT, and WY • 3SAQS 2008 Base version A (3SAQS_CAMx_Base08a) is developed directly from the WestJumpAQMS Final Base (Base08c) platform • Key differences in 3SAQS_CAMx_Base08a from WestJumpAQMS Base08c: • Updated MOVES on-road mobile emissions • Updated ancillary emissions data for livestock, on-road mobile, off-road mobile, nonpoint, and residential wood combustion sources • All other modeling parameters are exactly the same between WestJumpAQMS and 3SAQS
3SAQS CAMx Base08aSummary of Inputs • WestJumpAQMS WRF 2008 36/12km meteorology • MOZART4 IC/BC • 2008 Emissions • WRAP Phase III 2008 Oil and Gas EI • 2008 NEI O&G outside of WRAP basins • MEGAN biogenics • DEASCO3 fires • 2008 NEI (2007v5 and 2008v2 platforms) • Hourly 2008 CEMs for sources reporting to CAMD
Model Performance Evaluation • Model species • Gases: Ozone, CO, NOx • PM: Total PM2.5, EC, OC, SO4, NO3, NH4 • Deposition: total N and S (not presented here) • Performance statistics • Based on recent EPA publications and guidance • Fractional Bias (FB) and Error (FE) • Normalized Mean Bias (NMB) and Error (NME) • Coefficient of determination (R2) • Performance displays • Scatter plots, soccer plots, time series, and tile plots
Ozone Model Performance • Daily Maximum Ozone • Maximum Daily Average 8-hour Ozone (MDA8) • CAMx 12km grid cells paired in space and time with AQS (urban) and CASTNet (rural) monitors • With and without a 60 ppb floor on observations • Focus on O3 and precursor performance in 12-km domain, CO, UT, and WY
12-km Domain Hourly and MDA8 O3 • Biases switch from positive to negative and errors decrease with the 60 ppb threshold • Model tends to overpredict low observed values and underpredict high observed values
Colorado AQS Sites: Monthly Average Hourly O3 Diurnal Profiles Fall Summer Spring Winter AQS Obs --CAMx --
Fall Summer Spring Winter Utah AQS Sites: Monthly Average Hourly O3 Diurnal Profiles AQS Obs --CAMx --
Wyoming AQS Sites: Monthly Average Hourly O3 Diurnal Profiles Fall Summer Spring Winter AQS Obs --CAMx --
Utah AQS Sites: December 2008 O3 and NO2 • Diurnal patterns match well, but mismatch on magnitudes • NO2 diurnal patterns indicate a strong signal from onroad mobile • Under predicting NO2 and concentration spikes related to rush hour traffic bring O3 closer to observations; indicates need for more NOx in the model • Appears to be an emissions issue, although mixing may be playing a role overnight AQS Obs --CAMx --
Ozone Performance Summary • Seasonality: • Spring and summer 1-hr and 8-hr shows low bias in all three states at urban and rural sites • Low bias in all months at all CASTnet sites in three states • Positive bias in fall and December for CO urban sites • Positive bias in fall and winter for UT urban sites • Negative bias in February for WY urban sites • Diurnal Patterns: • Generally good match with observed diurnal variability, missing the magnitude • Across the board over estimates in the early morning hours (0-0700 LST) • Lowest biases during peak photochemical hours (1000-1600 LST)
NO2, CO, SO2 Performance Summary • Colorado • Positive NO2 biases for all months other than January • Negative CO biases for all months • Positive SO2 biases for all months (with errors > 100%) • Utah • Mostly negative biases for all species. • Positive bias for SO2 in February • Wyoming • Negative biases for all species • Errors > 100% for SO2 in almost all months (exceptions are Jan and Feb)
PM Model Performance • Combine program normalizes model and obs PM species • AMET matches the model output for particular locations to the corresponding observed values from one or more networks of monitors. • Comparisons of total PM2.5 and constituents by state and over the whole 12-km domain • Scatter plots of modeled vs. observed PM2.5 at the IMPROVE and CSN monitor locations by season, for each state, and the 12-km domain (note: no total PM2.5 in CASTNET, no CSN monitors in WY) • Soccer plots of performance measures for PM constituents by month, for each state, and the 12-km domain
PM2.5 Performance by Season - 12-km Domain Winter Spring Summer Fall
PM2.5 Performance by Season - CO Winter Spring SummerFall
PM Constituents CAMx vs. IMPROVE – CO SO4 NO3 OC EC
PM Constituents CAMx vs. CSN – CO SO4 NH4NO3 OC EC
PM2.5 Performance by Season - UT Winter Spring Summer Fall
PM Constituents CAMx vs. IMPROVE – UT SO4NO3 OC EC
PM2.5 Performance by Season - WY Winter Spring Summer Fall
PM Constituents CAMx vs. IMPROVE – WY SO4 NO3 OC EC
PM Constituents CAMx vs. CSN – UT SO4 NH4 NO3 OC EC
PM Performance Summary • Seasonality: • Winter and summer better correlated (at 12-km and state-level) • Low bias in summer in all three states • PM Composition: • The inorganic constituents (esp. NH4 and NO3) are under-biased in urban sites in UT. • SO4 and OC contribute most to the PM2.5 overprediction in winter in CO at rural sites. • Considerable overprediction in OC in fall months and EC in August.
PM Performance Summary • Intra-regional differences • Model biased higher in CO than in other two states in all seasons except in summer in urban locations • Model performance in urban UT sites shows low bias in summer, and slightly smaller but low bias in fall • Near- vs. remote-from-source differences: • Better correlation of rural sites with model than urban sites in winter and spring; opposite trend in summer and fall • Low bias in urban sites in all states in summer