Download
1 / 23
340 likes | 551 Views
COFFEE BASED AGROFORESTRY SYSTEMS. Competition (Robusta/Arabica) (with other regions). Environment. Sustainability. Poverty. But the coffee production chain is going through a severe crisis, with prices at their lowest ever. In coffee AF system, Coffee is the main actor as a cash crop.

E N D
Competition (Robusta/Arabica) (with other regions) Environment Sustainability Poverty
But the coffee production chain is going through a severe crisis, with prices at their lowest ever In coffee AF system, Coffee is the main actor as a cash crop As a consequence, a strong socio – economic negative impact on the populations and countries Can agroforestry play a role in facing the problem of the coffee crisis? (Can the tree help the bush?)
The main object of our research: • The coffee bush under shade - Coffee in pure culture is excluded (unless as control or reference) Any shading plant (trees or banana) For any use Include C. arabica and C. canephora var. Robusta No geographical restriction (unless natural)
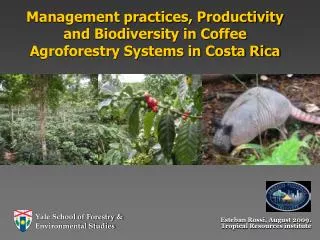
QUALITY MARKET PROFITABILITY VALUE ADDITION ENVIRONMENT Coffee naturally belongs to forest ecosystems It is well adapted to shade, and shade « bonafides » the coffee beans Trees can be the source of new income for coffee farmers through production diversification The coffee/tree association could help protect the environment
Coffee Agroforestry Systems QUALITY ENVIRONMENT VALUE ADDITION Biology Market studies Market organisation (internal / external) Certification Biodiversity Soil preservation Water management Ecology Agronomy, pathology, molecular biology Farming practices Diversification options Market organisation (internal) SUSTAINABLE ? maybe, if market oriented and flexible…. (?)
« Les Indications Géographiques » Tools for rural development
A global activity of 18 billion € • 15 % of the CA generated by the food industry (IAA). • A dominant export position of IG with 30% of the total from the food industry. Total Production billion € / 2001 Exportations billion € / 2001 I.a.a.(1) Products under IG.(2) (%) I.a.a.(1) Products under IG.(2) (%) 30 % 15 % (1) Agro-food industries (2) Appellation d’Origine Contrôlée (AOC), Indication Géographique Protégée (IGP) Source : MAAPAR, INAO, CFCE
IG product segmentation • Wine is in first position of the french IG sector with 75 % of the business generated by the « Indications Géographiques ». • All products (wine, cheese, other), except spirits, show high growth rates, with an average of 6,8% / year over the1997/2001 period. CA 1997 /Mds € CA 2001 /Mds € (%) TMCA 97 -2001 (%) (3) 5 6,6 1 4,7 11 5,2 8 0 IGP (1) Others (2) Cheeses Spirits 75 8,1 Wines AOC 13,86 100 6,8 Total 18,06 (1) Indication Géographiques Protégées • fruits, vegetables, spices... (3) Average annual growth rate Source : MAAPAR, INAO, ENITA Clermond-Fd
IG sector characteristics – stimulating rural development • With a total of 580 IG products, the sector represents 21 % of the French farmers. • The number of IG farmers increased by 14 % between 1997 et 2001, while the total number of farmers decreased by 4%. IG’s stimulate rural development. Products Producers (‘ 000) Total France IG farmers Numbert 450 43 22 65 580 Example St Emilion Champagne Comté, Roquefort Olive oil, honey Poultry, fruits, vegetables Type Wine AOC Dairy prod. Others TOTAL 1997 2001 1997 2001 (4)% +14 % Producers under IG 1997 : 18 % 2001 : 21 % Source : MAAPAR, INAO, ENITA Clermond-Fd
Evolution of wine production • Wines with IG represent, since 1994, more than 50% of the total production. • In a context of decreasing market (1% / year), the IG products continue to expand (+2,4 % / year). Annual wine production (‘ 000 hl) TMCA 75 -2000 (%) (1) (1)% 2,4 % (2,9)% (1) Taux Moyen de Croissance Annuel Source : ONIVINS
Market evolution TMCA 97 -2001 (%) (1) Indications Géographiques 6,8 % 4,2 % PIB 3,7 % I.a.a. 0,7 % Production agricole (1) aAverage annual growth rate Source : INAO, CNAOL, ENITA Clermond-Fd, évaluation MAAPAR
The sale prices of IG products are superior • The IG sale price is higher than for comparative non-IG products. The difference pays for the extra production costs and sends a quality signal to the consumers. In the case of cheese, the average difference is 30%. • The difference may be much greater in the case of wine Cheese price (1) E/kg Wine price (1) E/l A.O.C. Other wine A.O.C. Other cheese 30 % 230 % (1) basé sur les données export 99-2001 (1) basé sur panel SECODIP 2002 Source : MAAPAR, ONIVINS, CFCE, INAO
« Indications Géographiques »: an added value for the producers • The price premium pays for the added production costs required for the special product Milk price at farm level Price share of olive oil Non- AOC brand Compared to mean price AOC 90 % 20 E/l Sale price 35 % 30 % 15 % 5 % 14 E/l - Producer price • The part going to the producer in both cases is about 60% of the sale price. • In the case of AOC, the producer price is 50% higher. Brie de Maux Moyenne nationale 2002 Beaufort Reblochon Comté Maroilles Source : INRA, INAO, Huile d’olive de Nyons
The Camembert exemple • The positive effect of the « Camembert de Normandie » AOC : • An enhanced sale price (25%). • Reduced losses in competition with supermarket brand. Camembert price (E/u) National brands supermarket brand others A.O.C. others A.O.C. 25% (11) % (28) % • A 25% premium for the AOC product • Reduced loss in competition with the supermarket’s brand - (11) % vs. (28) % Source : INRA
An example from Vietnam : the Phu Quoc Nuoc Mam • The implementation of an IG for the Phu Quoc Nuoc Mam in 2001 has increased the value of the product and attracted an international investor (Unilever) who invested 1 million US$ for a partnership with local producers the Phu Quoc Nuoc Mam The IG consequences • Increased local price (from 0,5 to 1,5 E/l) • An internationally renowned product • 90 private industries produce the product on the island • A production of 10 millions litres • 0,5 million litres are exported • 80 % of sales in Japan and EU is smuggled in 2000 2003 X 3 2001, IG • 1 M US$ investment by Unilever to built a Knorr factory • IG / brand partnership, for local development • IG : an answer to smuggling. Source : Bureau National Interprofessionnel du Cognac, UNDP
Quality of different Honduran Coffees in Relation to Several Environments.Decazy et al. Journal of Food Science – Vol. 68, 7, 2003
Fermented Over-roasted Under-roasted Bad cup Insect damage Diseased Pulper nicked beans Water damaged Broken Coated Available quantity Season … Other parameters?