Download
1 / 16
160 likes | 227 Views
RGS-IBG Online CPD course in GIS Exploring ArcGIS. Session 5.

E N D
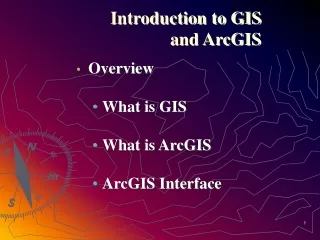
ESRI’s ArcGIS is one of many geographical information systems (GIS), or GIS software. A GIS allows you to interactively work with spatial data. ArcGIS is what ESRI refer to as a suite of products which can be tailored to your need. The basic version of ArcGIS is what we will be using in this course and is all the majority of GIS users will ever need, it is composed of three essential products; ArcMap, ArcCatalog and ArcToolBox. ArcMap is where you can see your map data, ArcCatalog allows you to organise your geographical data (much like Windows Explorer) and ArcToolBox holds some of the more advanced geoprocessing tools.
In this short exercise you will become familiar with ArcMap and begin to understand the building blocks of a GIS project. The objectives of this session are to understand the software’s interface and learn briefly how to load and explore data. In doing so, you will have integrated a number of datasets which form the basis of being able to interrogate data further. The data you will use are local authority areas and a small list of point locations of students’ addresses.
Objectives • Learn how to open ArcMap • Understand ArcMap’s interface • Understand the difference between loading data and loading a project • Become familiar with exploring data in ArcMap • Think Spatially!
Exercise In this short exercise you will become familiar with ArcMap and begin to understand the building blocks of a GIS project. The objectives of this session are to understand the software’s interface and learn briefly how to load and explore data. In doing so, you will have integrated a number of datasets which form the basis of being able to interrogate data further. The data you will use are local authority areas and a small list of point locations of students’ addresses. The data has been created for you and saved as a Project. Watch the following video, this will explain how to open a project in ArcMap.
Open ArcMap. Go to Start > All Programs > ArcGIS > ArcMap. • A dialogue box will appear. Choose to start using ArcMap by selecting the ‘A New Empty Map’ option. • You will see the following screen. Keep the following picture as reference, the Table of contents (TOC), the Data Frame and some of the tools will be referred to throughout the course.
Zoom, change view and navigate around the map Open Project (e.g. a .mxd file) Add Data (e.g. a .shp file) Identify Measure Table of Contents Data Frame
The Table of Contents • An ArcMap project is usually a collection of data. The project file itself is quite small in storage size, it is simply a collection of pointers to each of the data files within the project. ArcMap projects have the file extension .mxd. Now open a pre-saved project as you saw in the video. Click on the ‘Open Project’ folder. Navigate to where you saved the course data. Open the ‘5 Exploring GIS Data’ folder. You should see a project called ‘Students.mxd’, open this. • You will see a map of London’s local authorities from 2003 in the Data Frame. In the TOC you will see a layer called LondonBoroughs. Press on the tick to the left of this layer. London disappears! It is from the TOC you control the layers that are seen by simply turning the tick on and off. • Now click and hold down on where it says LondonBoroughs in the TOC. Drag it above Students. The students have now disappeared. Imagine looking down from the top of the TOC, the first layer you see is the first layer you would see looking down on the Earth’s surface.
Zooming and Navigation • Now explore the zooming functionality. There are four buttons to use. Two magnifying glasses, one with a minus symbol one with a plus; and two crosses, one with arrows pointing outwards and the other with arrows pointing inwards. The two crosses are known as ‘fixed zoom’ buttons, press them and notice how you can zoom in and out in increments. The magnifying glasses instead allow you to direct your zoom to a specific area. • Moving about the map. The hand is called the ‘pan’ button. This allows you to move the map to centre it where you choose. You will also notice two arrow buttons, one pointing left, the other right. These are like the ‘back’ and ‘forward’ buttons in Internet Explorer. They allow you to move back to a past map view before zooming in for example. Finally the button with a picture of the Earth on it. This is the ‘Full Extent’ button and it re-centres the view to include all the data.
Some Simple Functions • Press the measuring tool button (refer back to the screen map above). A small box will pop up with a number of options. Press the small down arrow button and change the distance units to kilometres. The buttons on the left allow you to measure a line, an area or a feature. Experiment with these. Tip: the line measuring tool allows you to measure segments as well as a cumulative distance. Press to start, press again for a segment, press again for another segment, and double click to finish. The ‘Measure a feature’ tool allows you to measure the actual features on the map, you only need to press this tool once, e.g. within a local authority. • The Identify tool operates the same way as the ‘Measure a Feature’. Press the Identify tool in a local authority of London. A box opens up showing you the attributes, or characteristics of a particular feature. You can see that GIS is not just about maps. Software such as ArcGIS is as much about the data behind the maps. You will explore this further another time.
Data for ArcMap comes in a variety of formats, one of the most common being a shapefile which has the extension .shp. Shapefiles are composed of at least three separate files however using ArcMap you will see what appears to be just one file. Having watched the video now add the location of the Royal Geographical Society to your map. Click on the ‘Add Data’ button and navigate to your personal folder. Open the RGS.shp file. It should appear as a small point near the centre of the map, you will learn in a later exercise to change the appearance of data to make it stand out more. (If you are unable to locate your data you may need to ‘Connect to Folder’ for which video instructions follow)
Now explore the aspatial, or attribute data of the local authority and student datasets. Right click on either of the layers and click on ‘open attribute table’. In both datasets you will see a ‘name’ attribute followed by some other attributes. In the local authorities data you will see some population data, in the student data you will see both name and gender data. You should notice that this is the same data the Identify tool was highlighting earlier, the difference here being you can see the whole layer’s (all the local authorities) data at the same time. Again this highlights that GIS is not just about maps. Close the tables. • Save the project by pressing the ‘disc’ button. Next time you open this project it will include the Royal Geographical Society.
Summary You should now know; • How to open an ArcMap project • How to add data to an ArcMap project • How to use some of the simple functions • That GIS is not just about maps, but data too Further Exercise You have now opened a project, integrated a further dataset and have quickly looked at the data contained within the GIS project. Think about how this sort of data can be used further and what sort of spatial problems it can help us understand.