Download
1 / 80
800 likes | 803 Views
Discover how collecting and analyzing data through school safety surveys and discipline data systems can help teams make informed decisions about school climate and safety.

E N D
School Teams Must Have Immediate Access to Data to Make Objective Decisions About School Climate & Safety -,Where to Start?
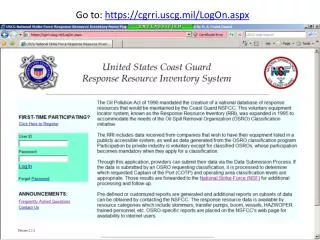
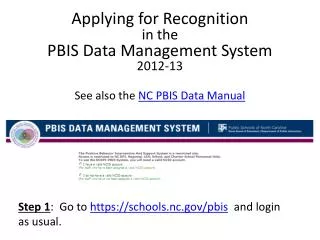
https://www.pbisapps.org/Applications/Pages/PBIS-Assessment.aspx
Information Systems for Data-Based Decision Making Desired Outcomes: School Safety Survey (SSS) Suspensions, Expulsions, Remands Office Discipline Referrals (ODRs) Fidelity of Implementation: School-wide Evaluation Tool (SET) Self Assessment Survey (SAS) Benchmarks of Quality (BOQ)
Information Systems for Data-Based Decision Making Desired Outcomes: School Safety Survey (SSS)
School Safety Survey (SSS) Data Collection Protocol • Collected annually – usually in the spring. • Completed by all adults in the school • Completed by a representative sample of students at each school. (Each homeroom teacher at grades four and above select 4 students in his/her homeroom who represent the range of academic performance of his/her students: e.g. one student who is advanced, two students who are proficient, and one who is not proficient) • Students in grades 4 and 5 take a different version of the survey that provides more extensive explanation of questions Overview The School Safety Survey (SSS) is a web-based instrument developed to obtain an efficient index of perceived school safety.The SSS provides a summary of "risk factors" and "protective factors" that are used to determine training and support needs related to school safety and violence prevention
Section 1: Risk Factors School Safety Results
Information Systems for Data-Based Decision Making Desired Outcomes: School Safety Survey (SSS) Suspensions, Expulsions, Remands
Information Systems for Data-Based Decision Making Desired Outcomes: School Safety Survey (SSS) Suspensions, Expulsions, Remands Office Discipline Referrals (ODRs)
Essential Data for School-Based Decision-Making • Referrals byproblem behavior? • What problem behaviors are most common? • Referrals bylocation? • Are there specific problem locations? • Referrals bytime of day? • Are there specific times when problems occur? • Referrals bystudent? • Are there many students receiving referrals or only a small number of students with many referrals?
Why Collect Discipline Information? • Objective decision-making • Professional accountability – confirm interventions are effective/successful • Decisions made with data (information) are more likely to (a) be implemented and (b) be effective
SWIS (School-wide Information System) • Web-based information system for gathering and summarizing problem behavior information. • Summarizes office discipline referral information by (a) how often, (b) where, (c) when, (d) what, and (e) who. • Summaries provided in tables and graphs. • Confidentiality protected. • $300 per school per year annual fee for SWIS. Additional $100 for SWIS-CICO TM.
Key Features of Data Systems that Work • The data are accurate • The data are very easy to collect (1% of staff time)
Key Features of Data Systems that Work • The data are accurate • The data are very easy to collect (1% of staff time) • Data are used for decision-making • The data must be available when decisions need to be made (weekly?) • Difference between data needs at a school building versus data needs for a district • The people who collect the data must see the information used for decision-making
Using Office Discipline Referral Data for On-Going Problem Solving • Use data in decision layers and the“Big Five” • Is there a problem? • Attendance • Faculty Reports • Office Referrals per Day per Month
Using Office Discipline Referral Data for On-Going Problem Solving • Use data in decision layers and the “Big Five” • Is there a problem? • What “system(s)” are problematic? • What individuals (individual units) are problematic? • Don’t drown in the data • It’s “OK” to be doing well • Be efficient
Using Office Discipline Referral Data for On-Going Problem Solving • Is there a problem?
Compare the trends for Total Number of Referrals Per Month with…. Average number of referrals per day per month
Interpreting Office Referral Data:Is there a problem? • Absolute level (depending on size of school) • High Schools (1/95) • Middle Schools (1/109) • Elementary Schools (1/300) • Trends • Peaks before breaks? • Gradual increasing trend across year? • Compare levels to last year • Improvement?
Is There a Problem? Elem. School Office Referrals per Day per Month 2 Maintain - Modify - Terminate 1.5 Ave Referrals per Day 1 0.5 0 Sept Oct Nov Dec Jan Feb Mar Apr May Jun School Months 500 Students
M.S. Office Referrals per Day per Month 20 15 10 Ave Referrals per Day 5 0 Sept Oct Nov Dec Jan Feb Mar Apr May Jun School Months Is There a Problem? Maintain - Modify - Terminate 500 Students
H.S. Office Referrals per Day per Month 20 15 10 Ave Referrals per Day 5 0 Sept Oct Nov Dec Jan Feb Mar Apr May Jun School Months Is There a Problem? Maintain - Modify - Terminate 1000 Students
H.S. Office Referrals per Day per Month 20 15 10 Ave Referrals per Day 5 0 Sept Oct Nov Dec Jan Feb Mar Apr May Jun School Months Is There a Problem? Maintain - Modify - Terminate 2000 Students
2. WHAT SYSTEMS ARE PROBLEMATIC? • Referrals by problem behavior? • What problem behaviors are most common? • Referrals by location? • Are there specific problem locations? • Referrals by time of day? • Are there specific times when problems occur?
Problem Behavior
Frequency of Discipline Referrals By Grade Level (WHO) 140 120 100 80 Number of Referrals 60 40 20 0 6th 7th 8th 9th Discipline Referrals By Grade Level
3. Which students are receiving the referrals? Referrals by Student? Are there many students receiving referrals or only a small number of students with many referrals?