Download
1 / 47
470 likes | 499 Views
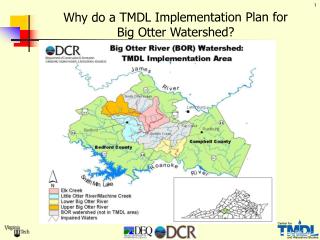
Big Raccoon Creek Watershed TMDL. Stakeholder Meeting June 26, 2013. Watershed Overview Listing Information Allowable Loads TMDL Allocations Implementation TMDL Process. Agenda. Watershed Overview. Big Raccoon Creek Watershed. Located above Cecil M. Harden Lake

E N D
Big Raccoon Creek Watershed TMDL Stakeholder Meeting June 26, 2013
Watershed Overview Listing Information Allowable Loads TMDL Allocations Implementation TMDL Process Agenda
Big Raccoon Creek Watershed Located above Cecil M. Harden Lake Drains 215 square miles Counties -Boone -Hendricks -Montgomery -Putnam -Parke Municipalities - Advance -New Ross -Ladoga -Roachdale
Historic Sampling • Fixed Station Data 1999-2013 • Probabilistic Sampling 1999, 2004, 2009 • Second Year Study in 2005 • Lake Data in 1991, 1997, 1999 • Cyanobacteria and Microcystin Beach Sampling in 2011 and 2012
Draft 2012 303(d) Listings Approximately 81 stream miles impaired: • 62 stream miles Impaired Biotic Community (IBC) • 36 stream miles E. coli • Cecil M. Harden Lake for Mercury and PCBs
Fish Community and Water Chemistry Sampling in 2005 28 sites for fish community 28 sites sampled for water chemistry Data used for IBC TMDL development Assessment of Water Quality
Biological Data • 20% (6/28) sites had Impaired Biological Communities
Chemistry Data No obvious chemical impairments DO=2.1 DO=13.3 DO=3.5 DO=2.5 TP=0.33 TSS=74 DO=3.5 TP=0.68
E. coli sampling performed by IDEM in 2010 15 sites for E. coli Sampled 5 consecutive weeks Data used for E. coli TMDL development Assessment of Water Quality
E. coli Data • Geometric mean calculated for each site • All 15 sites reported as not meeting the standard in 2010 • Highest geometric mean = 2214.3 • Site WLV160-0038 • Lowest geometric mean = 543.13 • Site WLV160-0035 • Highest single sample = 2419.6 • Every site • Lowest single sample = 191.8 • Site WLV160-0015
Impaired Biological Communities (IBC) Results • IBI - Index of Biotic Integrity ≥ 36 (WQS) • Dissolved Oxygen - ≥ 4.0 mg/L (WQS) • Total Phosphorus - ≤ 0.30 mg/L (U.S. EPA) • Total Suspended Solids - ≤ 30.0 mg/L (IN NPDES permitting)
The sum of allowable loads from point sources, waste load allocations (WLA) and nonpoint sources, load allocations (LA) plus a margin of safety (MOS) TMDL = ∑WLA + ∑LA + MOS The Definition of a TMDL
Allocations • Waste load Allocation (WLA) • WLAs are the contributions from point sources • Point sources are easierto identify since they have a discharge point or direct outlet to the stream • Point sources have some type of monitoring or information and are therefore easier to assign loadings
Allocations • Load Allocation (LA) • LAs are the pollutant contributions from nonpoint sources, which are not directly regulated • "Diffuse" pollution, generated from large areas with no particular point of pollutant origin, but rather from many individual places • Pollution that cannot be traced to a regulated direct outlet or discharge point
Clean Water Act requires that TMDL be allocated as follows: TMDL = WLA + LA + MOS Waste load allocations (WLA) for “point sources” (regulated under NPDES) Load allocations (LA) for nonpoint sources MOS for margin of safety TMDL Allocations
Waste load Allocations 4 NPDES facilities with sanitary component 1 CFO Demaree Farms Partnership: WLA= 0 Illicitly connected on-site systems (i.e., straight pipe dischargers) are zero Big Raccoon Creek TMDL Allocations
Waste Load Allocations for E. coli Advance WWTP: 0.14 (Billion/Day) New Ross WWTP: 1.23 (Billion/Day) Roachdale WWTP: 0.59 (Billion/Day) Ladoga WWTP: 0.93 (Billion/Day) Big Raccoon Creek TMDL Allocations
Load Allocations Agricultural Run-off Failing Septic Systems Livestock Stream Bank Erosion Urban Run-off Wildlife Big Raccoon Creek TMDL Allocations
Allocation Development • Data used to develop allocation • Precipitation • National Oceanic and Atmospheric Administration (NOAA) weather station • Flow • U.S. Geological Survey (USGS) Flow Gage • Modeling Using IDEM Data • Spreadsheet modeling tool • Traditional modeling
Precipitation • Many sources of pollution are impacted by precipitation • A path for pollutants to enter a waterbody is through rain and snow melt • Information on precipitation used with the Load Duration Curve (LDC) will give a better overall sense of flow conditions in stream
Flow • The long history of flow gages provides a valuable tool in evaluating water quality data • USGS flow gages provide a consistent high quality source of flow information • The large network of flow gages means that finding a representative flow gage is possible
High Flows Moist Conditions Mid-Range Flows Dry Conditons Low Flows Load Duration Curve IDEM Data & USGS Gage 03340800 Flow Data Upstream Drainage Area is 27.38 Square Miles
Phosphorus and TSS Load Reductions Needed
Implementation of TMDL expected to occur via current and future activities such as: Vegetated filter strips Stream fencing (animal exclusion) Control of failing septic systems Conservation tillage Urban conservation practices Additional agricultural conservation practices Implementation
Current & Past Projects • LARE Grants • Critical Area Plantings • Grade Stabilization Structures • Livestock Watering Facilities • Grassed Waterways • Tree Plantings • Pasture and Hay Planting Conservation Funding • Clean Water Indiana (CWI) • Environmental Quality Incentives Program (EQIP) • Conservation Reserve Program (CRP) • Wildlife Habitat Cost-share Program (WHCP) • Section 319 Nonpoint Source Water Quality Funding • Game Bird Habitat Development Program (GHDP) • Wildlife Habitat Incentive Program (WHIP) • Conservation Stewardship Program (CSP) • Wetland Reserve Program (WRP)
BMP Implementation Areas Increase Riparian Buffers Livestock Exclusion Fencing Grazing Land Management Alternative Watering Systems
BMP Implementation Areas Reduce Sediment Loads Grassed Waterways
Monitoring: Spring 2010 Draft TMDL Meeting: Summer 2013 30-day Comment Period: Summer 2013 (www.idem.IN.gov/nps/2652.htm) Final TMDL Report Submittal to U.S. EPA: Fall 2013 Big Raccoon CreekWatershed TMDL Schedule
Who Fixes It? You! But there is help…
Ali Meils TMDL Project Manager Office of Water Quality Indiana Department of Environmental Management 100 N. Senate Ave. Indianapolis, Indiana 46204-2251 Phone: (317) 308-3204 Fax: (317) 308-3219 E-mail: ameils@idem.IN.gov http://www.idem.IN.gov/nps/2652.htm TMDL Project Manager