Download

1 / 62
620 likes | 805 Views
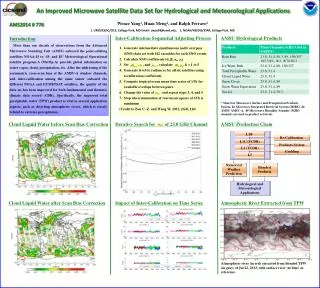
Operational Calibration of Satellite Microwave Instruments for Weather and Climate Applications. Fuzhong Weng and Tsan Mo Sensor Physics Branch NOAA/NESDIS/Office of Research and Applications Banghua Yan, QSS Group Inc. Ninghai Sun, IMSG and many others.

E N D
Operational Calibration of Satellite Microwave Instruments for Weather and Climate Applications Fuzhong Weng and Tsan Mo Sensor Physics Branch NOAA/NESDIS/Office of Research and Applications Banghua Yan, QSS Group Inc. Ninghai Sun, IMSG and many others Achieving Satellite Instrument Calibration for Climate Change (ASIC3) Workshop, May 16-18, 2006
Outline • Significance of satellite instrument calibration • Microwave instrument calibration components • Microwave sensor calibration for operational and research satellites • Issues and Challenges • Summary and Conclusions
Global Temperature Trend Depicted by NOAA MSU and AMSU Combined MSU and AMSU observations can be used to detect climate trend, however, different merging procedure in removing intersatellite biases causes different trend results 5-day and global-ocean-averaged time series for NOAA 10,11,12, and 14 obtained from MSU 1B data which uses NESDIS operational calibration algorithm
Calibration Accuracy in Relation to Climate Trend – Ocean Mean Wind Speed Tropical mean wind speed increases 0.5 m/s per decade. Is the recent increasing hurricane wind damage responding to this trend? How can we assure this trend not related to inter-satellite calibration and algorithms This is the case for SSM/I 37 GHz, V-Pol, surface wind > 12 m/s. The sensitivity of wind speed to brightness temperature is about 1. – 3 m/s/K.
Calibration in Support of Satellite Data Assimilation • No radiance biases • Instrument • Forward model • Known Errors • Observation • Forward model • where • x is a vector including all possible atmospheric and surface parameters. • I is the radiance vector • B is the error covariance matrix of background • E is the observation error covariance matrix • F is the radiative transfer model error matrix You can’t simply fudge the weights!
Comparison of Impact of Observing Sounding Data From Roger Sounder, The Metoffice, UK Global degradation Ten years ago? TOVS NESDIS retrievals, AMV, more but lower quality radiosondes
Microwave Instrument Calibration Components Energy sources entering feed for a reflector configuration • Earth scene Component, • Reflector emission • Sensor emission viewed through reflector, • Sensor reflection viewed through reflector, • Spacecraft emission viewed through reflector, • Spacecraft reflection viewed through reflector, • Spillover directly from space, • Spillover emission from sensor, • Spillover reflected off sensor from spacecraft, • Spillover reflected off sensor from space, • Spillover emission from spacecraft
Antenna Feed Horn Emission & absorption by antenna & front-end. T’b Waveguide [1] T = Physical temperature of antenna, feed horn, waveguide, etc., Two-point radiometer calibration : ta= Transmittance due to absorption of antenna, feed horn, etc., Tb [2] Combining (1) and (2) : Tb= Tbo + DTb [3a] Emission by the antenna and front-end components can introduce a diurnal temperature variation. [3b] [3c] Example: Emission by Antenna/Front End Component
A very small portion of the antenna side lobes “sees” radiation emanating from outside the Earth. An even smaller portion, hS( antenna gain) results from the solar radiation, TSL, being reflected with reflectivity R from materials onboard the spacecraft. The brightness temperature can also be written as Earth where Example: Spill-Over due to Antenna Side-Lobes
Example: Non-Linear Calibration V Time-averaged voltage : Square Law I V [1] Detector Input Current Output Voltage m I Nyquist theorem : K=Boltzman’s constant G=Amplifier gain, B=Bandwidth T=Amplifier temperature, Te = Radiometric temperature [2] Combining [1] and [2] : [3] Two-point radiometer calibration eliminates boand b1 from <V> (output in counts) so that At microwave region:
NESDIS/STAR Integrated Cal/Val System • Current Capabilities: • Noise quantification (NEDT), • Linear and non-linear calibration algorithms, • Correction of sudden jumps and contamination associated with warm load and space view calibration counts, • Monitoring instrument noise, gain, telemetry and PRT uniformity, • Mitigation of radio frequency interference, • Global bias analysis from forward calculations using NWP models, • Time series of SNO/SCO matched data from a pair of operational satellites, • Time series of updated calibration coefficients with digital access, • Reference areas/site for vicarious calibration, • Monitoring of key MW products sensitive to calibration • Future Capabilities: Validation of EDRs
NOAA AMSU Sensor • Flown Since NOAA-15 (May 1998) • Contains 20 channels: • AMSU-A • 15 channels • 23 – 89 GHz • AMSU-B (now MHS on NOAA-18) • 5 channels • 89 – 183 GHz • 6-hour temporal sampling: • 200, 730, 1400, 1930 LST
NOAA AMSU Calibration and Monitoring • Pre-launch checkup • Noise quantification (NEDT) from EDU and PFM • Non-linearity • ….. • Update AMSU/MHS Calibration Parameters Input Data Set (CPIDS) in Level 1B, • Polynomial coefficients form converting PRT counts into temperature • Warm load correction at three instrument temperatures, • Cold spaces correction to the cosmic background temperatures • Error limits of warm and cold radiometric counts between the sample of the same scan line, • Non-linearity parameter • Temperature to radiance conversion factors • Min and max of RF shelf instrument temperature sensors • Analog data conversion coeff • Antenna position data in counts • Gross radiometric limits (max and min) on space and warm targets views • Antenna pattern parameters for lunar correction • Asymmetry correction • On-board Monitoring • Correction of sudden jumps and contamination associated with warm load and space view calibration counts, • Monitoring instrument noise, gain, telemetry and PRT uniformity, • Detect the radio frequency interference from AMSU, • Global bias analysis from forward calculations using NWP models, • Time series of SNO/SCO matched data from a pair of operational satellites, • Reference areas/site for vicarious calibration, • key MW products sensitive to calibration (Cloud Liquid Water and Precip)
Pre- and Post-launch Noise Characterization NOAA-18 AMSU-A NOAA-18 MHS
NOAA-15 AMSU-A Asymmetry Correction , ∆T = A0 exp{ -0.5[(θ - A1) /A2]2 } + A3 + A4 θ + A5 θ2
Effects of Biases on Operational Products NOAA-15 • AMSU A2 model cross scan asymmetry was detected from the first NOAA-15 cloud liquid water • Physical retrievals of cloud liquid water are directly subject to instrument biases • If AMSU cloud liquid water is assimilated or used for QC others, it results in global false alarm clouds and rejection of many other useful information • Bad consequence from AMSU xing scan radiance biases if not corrected because CLW is used for NWP QC NOAA-16
DMSP Special Sensor Microwave Imager and Sounder (SSMIS) • The Defense Meteorological Satellite Program (DMSP) successfully launched the first of five Special Sensor Microwave Imager/Sounder (SSMIS) on 18 October 2003. • SSMIS is a joint United States Air Force/Navy multi-channel passive microwave sensor • Combines and extends the current imaging and sounding capabilities of three separate DMSP microwave sensors, SSM/T, SSM/T-2 and SSM/I, with surface imaging, temperature and humidity sounding channels combined. • The SSMIS measures partially polarized radiances in 24 channels covering a wide range of frequencies (19 – 183 GHz) • conical scan geometry at an earth incidence angle of 53 degrees • maintains uniform spatial resolution, polarization purity and common fields of view for all channels across the entire swath of 1700 km.
0600 • As of August 2005 1200 0000 N N18 DMSP LTANs F13 1818 F14 2012 F15 2130 F16 2000 NOAA LTANs N15 1903 N16 1430 N17 2204 N18 1359 N16 N17 F15 F14 F16 F13 N15 1800 DMSP and NOAA Constellation
SSMIS vs. AMSU Sounding SSMIS vs. AMSU-A Weighting Functions Oxygen Band Channels SSMIS 13 Channels Sfc – 80 km AMSU-A 13 Channels Sfc - 40 km
SSMIS Antenna System and Calibration • Main-reflector conically scans the earth scene • Sub-reflector views cold space to provide one of two-point calibration measurements • Warm loads are directly viewed by feedhorn to provide other measurements in two-point calibration system • The SSMIS main reflector emits radiation from its coating material • SiOx VDA (coated vapor-deposited aluminum) • SiOx and Al VDA Mixture • Graphite Epoxy • Warm load calibration is contaminated by solar and stray Lights • Reflection Off of the Canister Top into Warm Load • Direct Illumination of the Warm Load Tines • Lunar contamination on space view
SSMIS Anomaly Distribution Shown is the difference between simulated and observed SSMIS 54.4 GHz. The SSMIS is the first conical microwave sounding instrument, precursor of NPOESS CMIS. The calibration of this instrument remains unresolved after 2 years of the lunch of DMSP F16. The outstanding anomalies have been identified from three processes: 1) antenna emission after satellite out of the earth eclipse which contaminates the measurements in ascending node and small part in descending node, 2) solar heating to the warm calibration target and 3) solar reflection from canister tip, both of which affect most of parts of descending node.
SSMIS Anomalies and Their Mitigation Algorithms Anomaly Causes Anomaly Mitigation Process • Antenna is not a pure reflector. It emits radiation with a very small emissivity and its own temperature. This additional radiation is called as an antenna emission anomaly • Warm load is heated by intruded solar radiation. The energy received through feedhorn does not match with the warm load physical temperature measured by the platinum résistance thermisters (PRT). This is referred as a warm load anomaly • The radiance from space view by the sub-reflector does not correspond to the sum of cosmic background temperature (2.73K) and pre-calculated correction values for each channel due to antenna side-lobe effort. • Use the emissivity from NRL antenna model and the temperature measured from the thermister mounted on antenna arm as approximation • Analyze the time series of warm load counts together with PRT and define the anomaly locations in terms of the FFT harmonics • Analyze the time series of cold space view count and define the anomaly locations in terms of the FFT harmonics and cosmic temperature plus antenna correction
where TA is the antenna temperature corresponding to the earth scene’s radiance, and R and TR is the reflector emissivity and Temperature, respectively SSMIS Calibration Algorithms • Use the emissivity from NRL antenna model and the temperature measured from the thermister mounted on antenna arm as an approximation • Analyze the time series of warm load counts together with PRT and define the anomaly locations in terms of the FFT harmonics • Analyze the time series of cold space view count and define the anomaly locations in terms of the FFT harmonics and cosmic temperature plus antenna correction
Theoretical SSMIS Reflector Surface Parameters (NRL Multilayer Antenna Model) Emissivity (V-pol/20deg) [ ∈ R ] Freq. (GHz) Al GrEp SiOx SiOx/Al 19.35 0.00051 0.012 0.91 0.00051 37.0 0.00071 0.016 0.91 0.00071 60.0 0.00090 0.020 0.91 0.00090 91.65 0.00111 0.025 0.91 0.00111 183.0 0.00157 0.035 0.91 0.00157
FFT Analyses of Warm Counts (54.4 GHz) Note:(1) CWF = FFT-1( FFT(CW) * Filter(fL) ) ), where fL is a cutoff frequency of the low pass filter, where T 102 minutes. (2) f0 is sampling frequency = 1.0/T.
SSMIS Antenna Temperature Bias February 3, 2006 Before anomaly correction After anomaly correction Temperature biases from TDR and SDR space are related through the slope coeff. for spill-over correction, Tb = a*Ta + b
Cloud Liquid Water Total Precipitable Water SSMIS-F16 SSM/I-F15 SSMIS vs. SSM/I Products
Other Microwave Instrument Calibration • Windsat vicarious calibration • Amazon/Congo basins • Time series of averaged 3rd and 4th components • Aqua AMSR-E radio frequency detection • Develop RFI index fro 6 V/H pol over land
Microwave Sensor Inter-calibration for Climate Applications • DMSP Series SSM/I (F8 to F15) • Data rescue and archival • Metadata for re-calibration • Inter-calibration using simultaneous conical overpassing • Reproduce all SSM/I EDRs climatology • NOAA MSU (N10-14) Time Series Analysis • Non-linearity parameter • Bias removal using SNO
Intersatellite Calibration Using Simultaneous Nadir/Conical Overpass (SNO/SCO) • SNO – every pair of POES satellites • with different altitudes make orbital intersections within a few seconds regularly in the polar regions (predictable w/ SGP4) • Precise coincidental pixel-by-pixel match-up data from radiometer pairs provide reliable long-term monitoring of instrument performance • The SNO method (Cao et al., 2005) is used for on-orbit long-term monitoring of imagers and sounders (AVHRR, HIRS, AMSU) and for retrospective intersatellite calibration from 1980 to 2003 to support climate studies • The method has been expanded for SSM/I with Simultaneous Conical Overpasses (SCO) SNOs occur regularly in the +/- 70 to 80 latitude
Calibration Issues That Affect NOAA Uses of Microwave Data in Weather and Climate Research
Summary and Conclusions • Operational microwave instruments AMSU-A/B (MHS) on board NOAA POES have been well calibrated for weather applications. Major NWP centers have demonstrated the greatest impacts on weather forecasts from direct radiance assimilation, and they are pleased with the quality of the microwave calibration algorithms developed by NESDIS/STAR. • DMSP SSMIS may soon become another major data source for NWP data assimilation. Currently, resolving its calibration uncertainty from antenna emission and contamination by solar/stray lights is of a highest priority. The NESDIS/STAR beta-version calibration algorithm has significantly eliminated most of anomalies. • The biases in the polarimetric microwave instruments (e.g. WindSAT) can be characterized from vicarious sites where surface polarimetric properties are well understood from some field campaigns and advanced radiative transfer modeling. • Intersatellite biases for microwave sounders or imagers can be quantified from simultaneous nadir/conical overpassing, but the bias characteristics from those surface sensitive channels could be quite significantly different from both poles. The differential biases may produce an inconsistent climate trending analysis. Thus, for climate studies, the current SNO/SCO algorithms may need some further constraints
Pre- and Post-launch Noise Characterization NOAA-18 AMSU-A NOAA-18 MHS
AMSU-A NEDT Trending Trending over 65 days
MHS Gain and NEDT Trending Trending over 65 days
Monitoring Uniformity of Warm Load PRT Temperatures T =Max – Min T Spec: T < 0.2 K
Linear and Non-linear Calibration Two Point Radiometer Linear Calibration: Radiance (Brightness Temp) (Cw, Rw) (Ce, Re) (Ce, RL) Two Point Radiometer with Nonlinear Calibration Correction: (Cc , 2.73K) Digital Counts where δR is the post-launch bias caused by factors other than non-linearity
Nonlinearity Spec: Ch.1, 2, 15: 0.5 K Ch.3-14: 0.375 K A1-1 Channels: Out of spec
Correction for Lunar Contamination on Cold Space Calibration
Possible Causes for AMSU Asymmetry • A misalignment of AMSU polarization vector • Mostly noticeable at clean window channels • Errors in Instrument pointing angle • It is unlikely because the cross-track pointing error (0.1 to 0.3 degree) is not large enough to produce this kind of asymmetry. • Side lobe intrusion to the solar array • There should be some latitudinal dependence • The response would occur at multiple channels
AMSU-A Gain Trending Trending over 65 days
Trending for AMSU-A Calibration Counts Trending over 65 days Offset Changed
Vicarious Calibration Using Libyan Desert Libyan Desert July 2005
Backup Slides: Windsat and AMSR-E Calibration and Monitoring