Download
1 / 18
180 likes | 216 Views
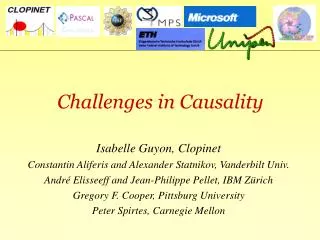
Causality Project. Team 1 David Conley Vijay Hattiangadi Byung Lee Jennifer Stoneking. Brief Introduction.

E N D
Causality Project • Team 1 • David Conley • Vijay Hattiangadi • Byung Lee • Jennifer Stoneking
Brief Introduction • “This Causes That” is a web application that provides users with the ability to create and view relationships between different environmental issues. • Our task is to study and analyze first-time user experiences with the current application interface and functionality. • We will introduce current problems, discuss testing procedures, and evaluate first-time user experiences.
Heuristic Evaluations • Each member of the group conducted their own, independent heuristic evaluation • We navigated through the interface, created relationships, etc. • Along the way, we noted characteristics of the interface that could potentially cause problems. • We then came together with our individual issues and determined which would be worth focusing on.
Usability Problems we found... • The idea that the website is trying to latch onto is very complex. • Breaking that down in a way users can understand is our primary challenge. • Our focus for usability is on: • Input for relationships • The visualization segment
Main Issues • Issues we’ve come across so far: • Organization & Navigation • No main page (yet!) • Navigation menu at the top • Use of terminology that may not be clear/appropriate • Looking for better terms • Linking between Wikipedia & website • Lack of instructions/guide for users
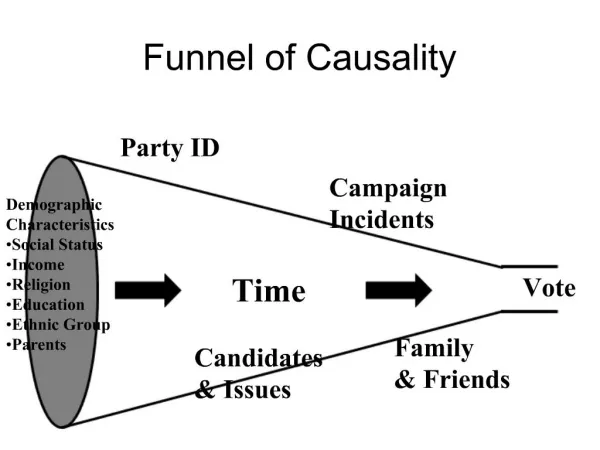
Secondary Issues • Color and size for fonts and images • Potential grouping mechanisms • No key or legend for the visualization • Page loading • Template loads quickly while Wikipedia info loads slowly
For smaller problems... • We will discuss problems that are easily fixable with the customer, suggest re-designs, and hopefully have the designs implemented immediately, before user testing begins.
Using Testing Going Forward • We’ll be using our testing to determine which of the issues we’ve come across are the most important • We will likely discover more issues as we go through testing
User Groups • Approximately 12 testers. • Testers will be selected randomly, with no preferences on age, academic level, major, or experience, however will be in equal amounts of female and male users. • Student groups from around campus will be informed of an environmental research study test and asked to volunteer. (Vijay)
Testing Environment • Location: TBA, likely in Calit2. • Estimated time: 30-45 minutes. • Split teams of four into of two pairs. • 1 as “note-taker,” 1 as proctor. • Screen/Audio Recording • Very similar to INF 131 term project. 11
Testing Procedure • Step 1: Brief Introduction • Gather basic information about users, then hand out UX welcome letter and discuss briefly the purpose of the experiment. • Note: Initial meeting will not give too much information away! • Step 2: Exploration • Users will navigate through the interface on their own individually for an undisclosed amount of time, and then explain their initial experience and opinion on the purpose of the site. 12
Testing Procedure (cont.) • Step 3: Account Creation • Each user will register and create a custom account for testing. • Step 4: Independent Relationship Creation • Users will create a relationship independently on an environment topic of their choice without any guidance. • Step 5: Specified Relationship Creation • Users will create specific relationships from a list of pre-determined issues. 13
Testing Procedure (cont.) • Step 6: Visualization Exploration • Users will explore visualizations of newly created relationships and determine/explain thoroughly the clarity and comprehension of the relationship map. • Step 7: Post-Test Interview • Users will be asked pre-determined questions regarding their experience testing the application as well as few questions to garner complete understanding of their mental process. (e.g. Scale of 1-5, Difficulties, Suggestions, Improvements, etc…) 14
What are we looking for? • How do users see the interface? What is the first thing that comes to their mind? What are things that peak their interest? • What parts of the interface are rarely used/irrelevant? What parts can be removed? • How accessible is the interface to average users? In other words, are things clear and easy to grasp? Can users perform basic tasks without difficulty? • How can we make this interface better and faster? 15