Download
1 / 48
480 likes | 592 Views
2009 MyOcean CALL for R&D proposals. MEsoSCale dynamical Analysis through combined model, satellite and in situ data. PI : Bruno Buongiorno Nardelli 1 Co-PI: Ananda Pascual 2 & Marie-Hélène Rio 3

E N D
2009 MyOcean CALL for R&D proposals MEsoSCale dynamical Analysis through combined model, satellite and in situ data PI: Bruno BuongiornoNardelli1 Co-PI: Ananda Pascual2 & Marie-Hélène Rio3 Participants: F.Bignami1, S. Guinehut3, G. Larnicol3, S. Mulet3, S.Ruiz2, J. Tintorè2 External expert: Y. Drillet4 1 2 3 4
MESCLA concept • Mainobjective and approach • Scientificmotivation • Mainactivities and expectedresults • Project organization • WorkpackageBreakdown • Timeschedule (GANTT) and requiredeffort • Scientificmeetings • First results Outline
MESCLA project is focused on the estimation and analysis of the vertical exchanges associated to mesoscale dynamics and of their interannual variability, concentrating on selected areas of the global oceans. • MESCLA approach includes: • the diagnosis and comparison of vertical velocity fields from MyOcean model output and synthetic 3D fields obtained by combining in situ and satellite data (e.g. MyOcean ARMOR-3D products) • the adaptation of ARMOR-3D processing chain to ingest higher resolution MyOcean SST L4 products and the development of new extrapolation methodologies to obtain experimental higher resolution 3D re-analyses (requiring the development and test of a high resolution SSS L4 product). • the analysis of the interannual variability of the vertical velocity fields Main objective and approach
MESCLA project is focused on the estimation and analysis of the vertical exchanges associated to mesoscale dynamics and of their interannual variability, concentrating on selected areas of the global oceans. • MESCLA approach includes: • the diagnosis and comparison of vertical velocity fields from MyOcean model output and synthetic 3D fields obtained by combining in situ and satellite data (e.g. MyOcean ARMOR-3D products) • the adaptation of ARMOR-3D processing chain to ingest higher resolution MyOcean SST L4 products and the development of new extrapolation methodologies to obtain experimental higher resolution 3D re-analyses (requiring the development and test of a high resolution SSS L4 product). • the analysis of the interannual variability of the vertical velocity fields • MESCLA will thus also contribute to the scientific improvement of MyOcean products, developing and testing experimental techniques that could be used in the long-term to build the next generation of operational products. FOCUS ON OBSERVATIONAL APPROACH NEW PRODUCTS DEVELOPMENT/TEST MODEL COMPARISON/VALIDATION Main objective and approach
Why mesoscale dynamics? Scientific motivation
Why mesoscale dynamics? Mesoscale dynamics modulates biological responses: Scientific motivation
Why mesoscale dynamics? Mesoscale dynamics modulates biological responses: Vertical displacements and mixing influence biology: upward transport of nutrients can lead to enhanced algal biomass in the photic zone… downward motions transport the biomass produced at the surface to deeper layers where it is remineralized, releasing once again nutrients into the dissolved phase... Mesoscale variability may have indirect consequences on ecosystem functioning and carbon cycle/climate Scientific motivation Figures extracted from: Lévy, M, Klein, P. and A.-M. Treguier (2001). Impacts of sub-mesoscale physics on phytoplankton production and subduction, J. Mar. Res., 59,535-565 doi: 10.1357/002224001762842181
Why mesoscale dynamics? Mesoscale dynamics modulates biological responses: Scientific motivation
Why mesoscale dynamics? The dynamical balance in key areas of the global oceans is mantained by mesoscale Scientific motivation
Why mesoscale dynamics? • The dynamical balance in key areas of the global oceans is mantained by mesoscale • EXAMPLE: • ACC frontalinstabilities at mesoscale carry momentum downward and both heat and mass poleward, counterbalancing the wind-drivenupwellingalongAntarctica Scientific motivation A typical SSH gradient ( α surface geostrophic velocity) field south of Australia and New Zealand (3 Jul 2002) From Sokolov and Rintoul, 2007
Why mesoscale dynamics? • The dynamical balance in key areas of the global oceans is mantained by mesoscale • EXAMPLE: • ACC frontalinstabilities at mesoscale carry momentum downward and both heat and mass poleward, counterbalancing the wind-drivenupwellingalongAntarctica • Mesoscale has a primary role in the global heat, freshwater, carbon, and nutrient budgets impact on global climate system • net effect under debate Scientific motivation A typical SSH gradient (surface geostrophic velocity) field south of Australia and New Zealand (3 Jul 2002) From Sokolov and Rintoul, 2007
Whatismissing? …intermsofunderstanding Effects of mesoscale on Climate and Biology Climate models have low resolution (computational limitations) Effects of mesoscale on property diffusion/transport need to be parameterized (e.g. through Eddy diffusivity) data assimilation in operational models allows more accurate analyses of vertical exchanges, but results can be significantly influenced by specific model configurations (e.g. forcing, parameterization of smaller scale processes and spatial resolution) Vertical velocities and space–timeresolution are key factorstounderstand mesoscale processes and their impact at global scale Scientific motivation Low resolution Medium resolution High resolution
Whatismissing? …intermsofunderstanding Effects of mesoscale on Climate and Biology Climate models have low resolution (computational limitations) Effects of mesoscale on property diffusion/transport need to be parameterized (e.g. through Eddy diffusivity) data assimilation in operational models allows more accurate analyses of vertical exchanges, but results can be significantly influenced by specific model configurations (e.g. forcing, parameterization of smaller scale processes and spatial resolution) New observational approaches can help to better understand the vertical exchanges associated with mesoscale processes, analyse their impact on ocean circulation and ecosystem and eventually help to define new parameterizations of mixing for climate models (far beyond MESCLA...) Scientific motivation Low resolution Medium resolution High resolution
Vertical velocity cannot be directly measured indirect methods require 3D density and velocity fields at high resolution (≤10 km, at least daily) Whatismissing? …intermsofparameters Scientific motivation
Vertical velocity cannot be directly measured indirect methods require 3D density and velocity fields at high resolution (≤10 km, at least daily, down to the bottom) • Vertical structure of the ocean is directly measured only by in situ observations sparse in space and time Whatismissing? …intermsofparameters Vertical profiles of temperature collected from ships in 1998 Scientific motivation Daily coverage by autonomous density profilers
Vertical velocity cannot be directly measured indirect methods require 3D density and velocity fields at high resolution (≤10 km, at least daily) • Vertical structure of the ocean is directly measured only by in situ observations: sparse in space and time • Satellite sensors only provide measurements of surface parameters different resolution/coverage depending on sensor Whatismissing? …intermsofparameters Scientific motivation ALTIMETER surface level, surface (geostrophic) currents only along track, low spatial coverage/repetitiveness PASSIVE INFRARED/MICROWAVE SENSORS Sea surface temperature Up to <10 km, daily only provide surface measurements
Which improvements within MESCLA? • Improve existing observational 3D fields (MyOcean ARMOR-3D) testing other multivariate techniques, merging in situ and satellite data and improving resolution • Taking advantage of: • higher resolution of satellite Sea Surface Temperature measurements • historical in situ dataset cover a high number of the possible states of the system • different parameters covariance Specific tasks/expected results • HIGHER RESOLUTION DATA • MyO SST L4 • New SSS L4 • NEW VERTICAL EXTRAPOLATION TECHNIQUE • Multivariate EOF Reconstruction High resolution 3D fields Temperature Salinity Density
Which improvements within MESCLA? • High resolution 3D velocity fields will be estimated from synthetic fields and model output through a diagnostic numerical model • These 3D velocity fields will be compared with estimates from MyOcean numerical model output Q-vector formulation of the OMEGA equation High resolution 3D fields Temperature Salinity Density High resolution 3D velocity fields Specific tasks/expected results w Vertical velocity U,V Horizontal geostrophic velocities
WP 1. Vertical velocity estimation from MyOcean products Task 1.1 Adaptation of the Omega equation model to MyOcean products Task 1.2 Application of the Omega equation model and comparison between different vertical velocity estimates WP2: Development of 3D-fields experimental products from observations Task 2.1 Ingestion of MyOcean SST L4 products in ARMOR Task 2.2 Development of a high resolution SSS L4 product Task 2.3 Test of a multivariate EOF reconstruction for the extrapolation of vertical profiles from surface measurements WP3: Analysis of the interannual variability of the vertical exchanges associated to mesoscale dynamics Task 3.1 Re-analysis of vertical velocities Task 3.2 Analysis of the vertical velocities variability Workpackage breakdown
Project schedule (GANTT) and required effort Task 1.1 Adaptation of the Omega equation model to MyOcean products Task 1.2 Application of the Omega equation model and comparison between different vertical velocity estimates Task 2.1 Ingestion of MyOcean SST L4 products in ARMOR Task 2.2 Development of a high resolution SSS L4 product Task 2.3 Test of a multivariate EOF reconstruction for the extrapolation of vertical profiles from surface measurements Task 3.1 Re-analysis of vertical velocities Task 3.2 Analysis of the vertical velocities variability
Project schedule (GANTT) and required effort MyO SDM Task 1.1 Adaptation of the Omega equation model to MyOcean products Task 1.2 Application of the Omega equation model and comparison between different vertical velocity estimates Task 2.1 Ingestion of MyOcean SST L4 products in ARMOR Task 2.2 Development of a high resolution SSS L4 product Task 2.3 Test of a multivariate EOF reconstruction for the extrapolation of vertical profiles from surface measurements Task 3.1 Re-analysis of vertical velocities Task 3.2 Analysis of the vertical velocities variability
WP 1. Vertical velocity estimation from MyOcean products Task 1.1 Adaptation of the Omega equation model to MyOcean products Task 1.2 Application of the Omega equation model and comparison between different vertical velocity estimates WP2: Development of 3D-fields experimental products from observations Task 2.1 Ingestion of MyOcean SST L4 products in ARMOR Task 2.2 Development of a high resolution SSS L4 product Task 2.3 Test of a multivariate EOF reconstruction for the extrapolation of vertical profiles from surface measurements WP3: Analysis of the interannual variability of the vertical exchanges associated to mesoscale dynamics Task 3.1 Re-analysis of vertical velocities Task 3.2 Analysis of the vertical velocities variability completed started started Workpackage breakdown completed started
Adaptation of the Omega equation to MyOcean products (resp. IMEDEA) • Selection of input data: • PSY3V2R2: 1/4º resolution on mercator grid. 50 vertical levels • PSY2V3R1: 1/12º resolution on mercator grid. 50 vertical levels • ARMOR3D – V1 (v5e1 and v5e2) • Domain: NW Atlantic. Gulf Stream • Date test: 10/10/2007 • Computation of geostrophic velocities (Dynamic Heights): • Sensitivity to the reference level: • 1000 m • surface SSH • Vertical interpolation: • 10:10:1000 m • Horizontal interpolation: • regulargrid (1/4º, 1/12º) • Conversion of data files to be ingested into the fortran code for the estimation of vector Q and vertical velocity • Estimation of vector Q and vertical velocity Task 1.1 Original profile Interpolated profile Example of a density profile
Applicaton of the Omega equation model and comparison between different vertical velocity estimates (resp. IMEDEA) PSY2V3R1 1/12º – ref level 1000 m SST DH Task 1.2 w-Omega (1/12°) w-model (1/12°)
Applicaton of the Omega equation model and comparison between different vertical velocity estimates (resp. IMEDEA) PSY2V3R1 1/12º – ref surf SSH SST DH Task 1.2 w-Omega (1/12°) w-model (1/12°)
Applicaton of the Omega equation model and comparison between different vertical velocity estimates (resp. IMEDEA) PSY2V3R1 1/12º – ref level 1000 m - zoom Task 1.2 w-Omega w-model
Applicaton of the Omega equation model and comparison between different vertical velocity estimates (resp. IMEDEA) PSY2V3R1 1/12º – ref level surf SSH - zoom Task 1.2 w-Omega w-model
Applicaton of the Omega equation model and comparison between different vertical velocity estimates (resp. IMEDEA) PSY3V2R2 ¼º – ref level 1000 m SST DH Task 1.2 w-Omega (1/4°) w-model (1/4°)
Applicaton of the Omega equation model and comparison between different vertical velocity estimates (resp. IMEDEA) PSY3V2R2 ¼º – ref surf SSH SST DH Task 1.2 w-Omega (1/4°) w-model (1/4°)
Applicaton of the Omega equation model and comparison between different vertical velocity estimates (resp. IMEDEA) ARMOR-3D V1 projection of SLA and SST onto 24 Levitus vertical levels SST DH Task 1.2 w-Omega (1/4°)
Applicaton of the Omega equation model and comparison between different vertical velocity estimates (resp. IMEDEA) ARMOR-3D V1 projection of SLA and SST onto 24 Levitus vertical levels + combination with in situ profiles SST DH Task 1.2 w-Omega (1/4°)
Applicaton of the Omega equation model and comparison between different vertical velocity estimates (resp. IMEDEA) ARMOR-3D V1 projection of SLA and SST onto 24 Levitus vertical levels + combination with in situ profiles SST DH Task 1.2 w-Omega (1/4°) w-model (1/12°)
Applicaton of the Omega equation model and comparison between different vertical velocity estimates (resp. IMEDEA) ARMOR-3D V1 projection of SLA and SST onto 24 Levitus vertical levels + combination with in situ profiles SST DH Task 1.2 w-Omega (1/4°) w-model (1/4°)
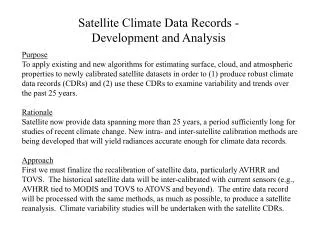
Ingestion of MyOcean SST L4 product in Armor3D (Resp. CLS) Armor3D: 2-step method based on observations and statistical method Step1: Vertical projection of satellite SLA+SST using a multiple linear regression method Step2: Combination of synthetic fields and in-situ T/S profiles using an optimal interpolation method • Historically, Armor3D-v0 uses Reynolds OI 1° SST • Armor3D-v1 uses Reynolds AVHRR-AMSR 1/4° SST (real-time and reanalysis) • Several global L4 SST products exists (MyOcean, other data centres): • How do they compare? • What is the impact on Armor3D? • What are there performances compared to independent Argo data set? Task 2.1
Ingestion of MyOcean SST L4 product in Armor3D (Resp. CLS) Comparison of different SST products Task 2.1
Ingestion of MyOcean SST L4 product in Armor3D (Resp. CLS) Comparison of different SST product increments weekly daily Task 2.1 daily daily
Ingestion of MyOcean SST L4 product in Armor3D (Resp. CLS) Impact of higher resolution on Armor3D 27/12/2006 Reynolds 1° Reynolds 1/4° SST Synthetic T at 30m Task 2.1 Synthetic T at 50m Synthetic T at 100m
Development of a high resolution Sea Surface Salinity (SSS) L4 product (Resp. CNR) SSS possibly needed by new 3D reconstruction methods new product potentially useful in combination with SMOS data Hypothesis: high correlation between sea surface temperature (SST) and sea surface salinity (SSS) variations can be expected (in the open ocean) at scales significantly smaller than the ones dominating atmospheric variability similar correlation found by Jones et al. (1998) between SSH and SST analogous results recently obtained looking at SST and SSS variability by Aretxabaleta et al. (2009, communication at EGU) and Ballabrera-Poy et al. (2009). Task 2.2 Proposed technique: optimal interpolation (Bretherton-like) algorithm that includes satellite SST differences in the covariance estimation
Test strategy and input datasets First tests: calculations performed on a single day (17th October 2007), limiting to a portion of the North Atlantic Ocean Covariance function parameters (i.e. spatial (L), temporal (τ) and thermal (T) decorrelationscales)determined empirically minimizing errors vs independent surface observations Salinity Observations (input data): MyOcean INSITU-TAC obs. from profiling floats, CTD and XCTD, referenced to 5 m depth SST observations: ODYSSEA L4 SST different filtering applied to remove the large-scale variability associated to air-sea interactions, trying to keep only the signals associated with the different water masses and related to mesoscale structures original SST values high-pass filtered data (keeping the scales smaller than 500 and 1000 km respectively). Background field: MyOcean CORIOLIS SSS objectively analyzed maps (covering the ½° MERCATOR grid) Validation data: thermosalinograph obs. provided by the Global Ocean Surface Underway Data project (GOSUD) and by the French Sea Surface Salinity Observation Service (at LEGOS) Task 2.2
Test datasets Task 2.2 in situ SSS Red dots (input) 30 days window, centered on interpolation day Blue dots (validation) (only for interpolation day)
Test Datasets Task 2.2 in situ SSS Red dots (input) 30 days window, centered on interpolation day Blue dots (validation) (only for interpolation day) Background SSS
Test datasets Task 2.2 in situ SSS Red dots (input) 30 days window, centered on interpolation day Blue dots (validation) (only for interpolation day) Background ODYSSEA L4 SST
Empirical determination of OI parameters: (T) (L) different values of noise-to-signal ratio Task 2.2 different values of temporal decorrelation scale (τ) RMSE (black contour) and MBE (red) vs validation data (expressed as % with respect to CORIOLIS –SSS L4 errors), as a function of the spatial and thermal decorrelation scales. High-pass filtered SST (<1000 km)
“Best” configuration and quantitative validation Task 2.2 lowest errors RMSE ~0.11 psu ~70% of CORIOLIS error MBE ~0.01 psu ~30% of CORIOLIS error L= 400 km τ=6 days T=2.75 °C signal-to-noise=0.01 High-pass filter: signals <1000 Km RMSE (black contour) and MBE (red) vs validation data (expressed as % with respect to CORIOLIS–SSS L4 errors)
Qualitative results: MESCLA high resolution SSS field and derived SSS gradient reveal more realistic and smaller scale structures than those visible in CORIOLIS-SSS product. MERCATOR 1/12° displays even smaller scales… Background MESCLA Task 2.2 MERCATOR
First resultspromising: • Omega gives accurate results at 1/12° (quantitative validation/analysistobecompleted) • ARMOR3D beingimproved in termsofresolution: soongetting the first 1/12° estimates (with standard 3D extrapolation) • Test of multivariate 3D extrapolationwill start soon (usingcombinationsof SSH, SST, SSS as input) • Methodfor SSS L4 estimate promising Conclusions and future work
OS3.2 From physical to biogeochemical processes: ocean mesoscale and sub-mesoscale impact on marine ecosystem and climate variability Convener: AnandaPascualCo-Conveners: John Allen, Bruno BuongiornoNardelli, Marina Lévy …This session will provide a forum to properly address the new scientific challenges associated with mesoscale and sub-mesoscale variability (between 1 km and 300 km), based on observations (both in situ and satellite and multi-sensor approaches), theory, and numerical simulations. …. IMPORTANT: Deadline for receipt of abstracts: 10 January 2011