1 / 7

Mapping Water Quality in the Red River Gorge

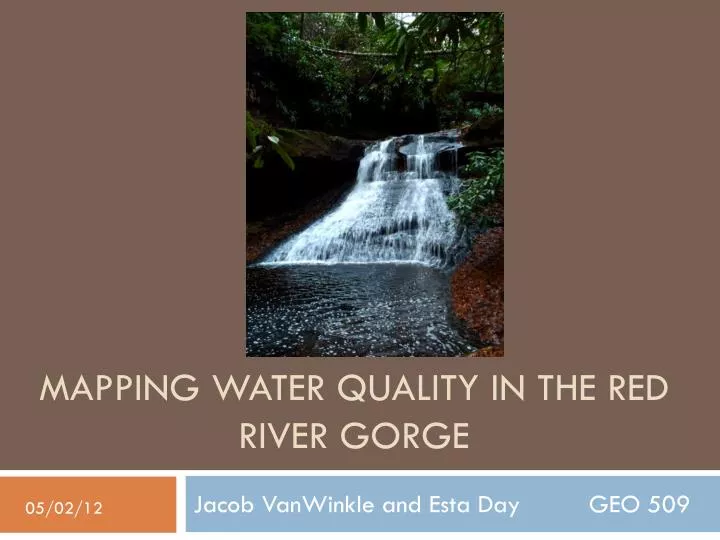
Mapping Water Quality in the Red River Gorge. Jacob VanWinkle and Esta Day GEO 509. 05/02/12. Kentucky River Watershed Watch. In the beginning. Initial plan. Early visualizations.

joshua
Download Presentation

Mapping Water Quality in the Red River Gorge

An Image/Link below is provided (as is) to download presentation Download Policy: Content on the Website is provided to you AS IS for your information and personal use and may not be sold / licensed / shared on other websites without getting consent from its author. Content is provided to you AS IS for your information and personal use only. Download presentation by click this link. While downloading, if for some reason you are not able to download a presentation, the publisher may have deleted the file from their server. During download, if you can't get a presentation, the file might be deleted by the publisher.

E N D

Presentation Transcript


  1. Mapping Water Quality in the Red River Gorge Jacob VanWinkle and Esta Day GEO 509 05/02/12

  2. Kentucky River Watershed Watch

  3. In the beginning Initial plan Early visualizations • “We will create maps that show the change in water quality over a specific period of time. These maps will be used to create a report detailing the water quality in the area.”

  4. There was not enough data to execute our initial plan.

  5. Change of plans

  6. Questions?

More Related