Download
1 / 16
160 likes | 259 Views
Impact of Frequency Control Supply by Wind Turbines on Balancing Costs. EWEA Conference Copenhagen , 18th April 2012 Malte Jansen (M.Eng) Fraunhofer IWES, Kassel malte.jansen@iwes.fraunhofer.de. Outline. Security Level. 12. Introduction Data & Model Offering Control Reserve

E N D
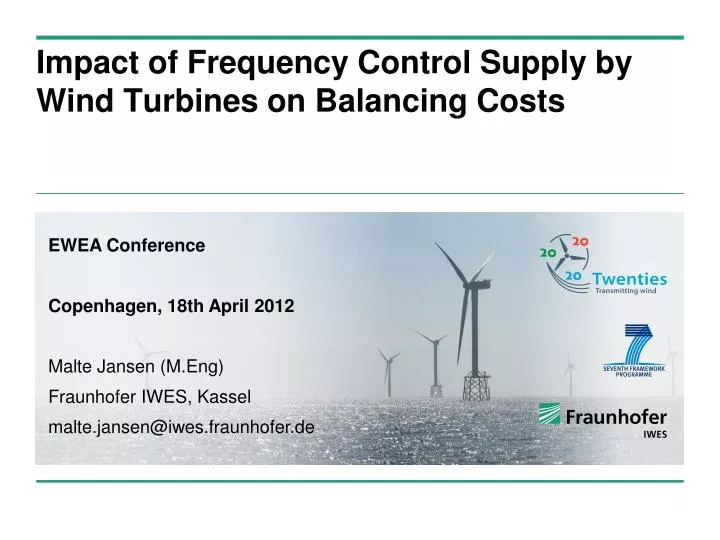
Impact of Frequency Control Supply by Wind Turbines on Balancing Costs • EWEA Conference • Copenhagen, 18th April 2012 • Malte Jansen (M.Eng) • Fraunhofer IWES, Kassel • malte.jansen@iwes.fraunhofer.de
Outline Security Level 12 • Introduction • Data & Model • Offering Control Reserve • Economic Impact • Results 95% • Howbigisthecontrolreserve potential of wind turbines in Germany? • Variation of Input Parameters • ProductLength • Security Level • BiddingStrategy • Howwouldcostsfortheprovisionofcontrolreservethenchange? 99% 10 99.9% Scenario / Inputparameter Offer Regulating Power (EP) 99.99% 8 IntraydayForecast Offer Regulating Power (CP) Simulations Day-Ahead Forecast Economic Impact 6 Regulating Power Data Lost Energy Power Exchange Data Regulating Power Potential 4 2 0
Wind TurbinesParticipation on Control Reserve Markets • Control Reserve Markets: • SecondaryMarkets (positive and negative) • Daily Tendering • TertiaryMarkets(positive and negative) • Primary Marketsare not considered • Time: 07/2010 – 12/2010 • OfferingwithintheGerman EEG (Renewable Energy Sources Act)
Modellingpossibleproofmethods Balance Control AvailableActive Power • Proof: • Controlreserve= schedule– actualfeed-in • Proof: • Controlreserve= availableactive power– actualfeed-in
Day-Ahead Forecast vs. Actual Feed-In Security levels: 95 % 99 % 99.9 % 99.99 % actualfeed-in
Intraday Forecast (1h) vs. Actual Feed-In • Increasedforecastquality • Decreasedleadtime • Considerationofpre-errors • Offering RP moreefficientfor high wind scenarios • In addition: Low energypricesduring high wind feed-in • Low losses in high wind scenarios Security levels: 95 % 99 % 99.9 % 99.99 % actualfeed-in • High lossesin low wind scenarios
Control Reserve Offer • Variation ofinputparameters • Security level • Block length • Lead time • Biddingstrategy • Result will leadto a trade-off betweensystemsecurityandeconomicefficiency Power (normalized) 0.3 0.25 0.2 00:00 04:00 08:00 12:00 16:00 20:00 0.15 Time 0.1 0.05 Actualfeed-in Secure day-aheadforecast Secure intradayforecast Offercontrolreserve
AlteringMerit-Order-Lists Merit-Order-List without Wind Merit-Order-List withWind New MO-Positions due to Market-Entry of Wind Turbines Participation WT on FC Market Energy Price in €/MWh Energy Price in €/MWh Min Max Capacity in MW Capacity in MW
Results (I) – Control Reserve Potential Security Level 12 95% 99% 10 99.9% 99.99% 8 OfferableRegulating Power Reserve [TWh] 6 4 2 24h 1h 4h 0 Productlength
Results (II) – ProductLength & Security Level Resultsfor negative secondaryreservebids x 106 3 1 HOUR 4 HOURS 24 HOURS 2 CostReduction [€] 1 0 95 % 99 % 99.9 % 99.99 % Security Level
AvailableActive Power Balance Control Results (III) – MethodtoproofthedeliveryofRegulating Power *106 3 • Cost-saving potential: • Availableactive power • Increasedcostefficiencycomparedtobalancecontrol • Improvement in efficiency • +12.1 @ 95% • +20.2 @ 99.99% • Higher marketshareof wind farms 2 1 0 95% 99% 99.9% 99.99% CostReduction [€] Security Level Resultsfor negative secondaryreservebids
Conclusions • Wind Farm participation in controlreservemarkets … • iseconomicallyfeasible • cansubstitutefossil fuelfired power plants • will increasecompetition in themarket • cangenerate additional revenueforthewindfarmoperators • Problems toovercomeare: • Proofdeliveryofservicesneedstobeadjusted
Malte Jansen (M.Eng) malte.jansen@iwes.fraunhofer.de ThankyouforYourAttention!