Download
1 / 33
330 likes | 437 Views
Geographic Information System and its Application in Hydro-Meteorology. Training Course on “Hydro-Meteorological Forecasting and GIS Application” RIMES, Bangkok, Thailand, 09th March 2010. Jothiganesh Shanmugasundaram Decision Support Tool Development Specialist.

E N D
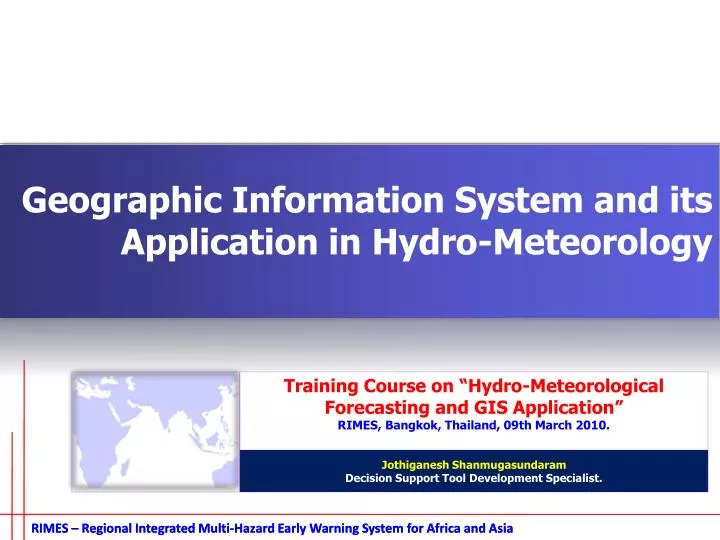
Geographic Information System and its Application in Hydro-Meteorology Training Course on “Hydro-Meteorological Forecasting and GIS Application” RIMES, Bangkok, Thailand, 09th March 2010. Jothiganesh Shanmugasundaram Decision Support Tool Development Specialist. RIMES – Regional Integrated Multi-Hazard Early Warning System for Africa and Asia
Presentation Outline Jothiganesh GIS Overview SAVGIS Introduction & Functionalities Geodatabase & Data Types Meteorological Applications Surface Observatory Data Management Forecast Data Management Forecast Verification Spatial Interpolation Weather Parameter Plots Hazard & Risk Assessment SAVGIS in Hydro-Met Applications Exercises for Practice
GIS Overview Hardware GIS has information of a object Software Database Where it is?, What it is? Visualization GIS can also answer Analysis What if? Where if? When if? Modeling Outputs Jothiganesh A System to capture, store, analyze, manage, and display the data that is linked to location. GIS tools allow users to visualize spatial data (2D&3D), create interactive queries, analyze spatial information, and generate maps.
GIS Overview Complexity in reading and understanding Easy to read and understand Level of Mapping World Asia Country District Jothiganesh
SAVGIS Introduction SAVATECA Database generation & management SAVEDIT Digitizing new relations, Import *.shp files, data quality checks and data format conversion SAVAMER Raster and Vector data georeferencing, mosaicing and Integration. System developed since 1984. Dr. Marc Souris, Institute of Research for Development (IRD, France) is the key person behind this. Freely available GIS tool www.savgis.org 3. Compatible with other GIS tool files and formats such as ESRI shape file, Ascii, Excel, Access etc., SAVANE Main module for Mapping and Analysis of data, Spatial and Surface Analysis functions, Geodatabase Visualization, Statistical and Geo-statistical Analysis. Jothiganesh
SAVGIS Functionalities • Geographic database management • 2D and 3D visualization • Spatial analysis • Statistical and Geo-statistical functions (Histograms, regression, covariance and PCA, Chi2,Ttest, Bayesian, Getis-Ord, Monte Carlo approach, Moran stat, etc.,) • Interpolation techniques • Digital elevation models • Data imports and exports (Shapefile, GeoTIFF…) • Spatial queries • Embedded Google Maps window… • Remote-sensing and Image processing • Digitization from Raster data such as scanned paper maps, satellite images etc., • Buffer and Network Analysis • Projection conversion and datum transformations Jothiganesh
Geodatabase • Geographic extent may vary from global to local scale. For example a geodatabase can be developed for whole world and also for a very small administrative area. • Geodatabase have all the datasets in same projection. It remains unaffected unless user delete in SAVATECA. Jothiganesh SAVGIS - Geodatabase is a database with group of geographical relations (Vector and Raster) layered in single base. Relations are connected with attributes which has the properties and details of the objects (linked with a location).
Geo-data Type VECTOR DATA RASTER DATA Polyline Rivers and streams Roadways Railways etc., Pixel based 1. ESRI ASCII 2.Image formats: tiff, jpeg, bmp 3. Grid datasets Point Village location Landmarks Met Station location etc., Jothiganesh Polygon Administrative boundaries Land use Geology map etc.,
Digital Elevation Model Hill Shade Slope Jothiganesh DEM is elevation dataset from USGS DEM elevation data can used to determine slope, aspect, hill shade and contour in SAVGIS
Spatial Analysis Figure shows rainfall distribution over the Bhutan region. Also it represents how it varies from place to place (spatially). Whatever objects you analyze with respect to space, it is called spatial analysis Jothiganesh Analysis which allows the user to study the relationship between location and its characteristics geographic feature. It is very useful for analyzing meteorological or hydrologic data in terms of geographic distribution, and for verification analyses of forecasts and warnings.
Temporal Analysis • Analysis which allows the user to study the variations of a parameter or phenomenon of a object over a location or geographic region. • Analyze patterns and behaviors • Identify anomalies Temporal analysis of grid location in Bhutan
GIS in Hydro-Met Applications • Exposure assessment with help of demography, environmental and socio-economic data • Historical impacts analysis for deriving thresholds by case analysis. • Evolving the process of generating pre-impact scenarios Jothiganesh Weather Database Management : Spatial and Temporal datasets of surface observatory and Forecast products Generate Value added products by adding Geographical Information to forecast. Serves to interpret and analyze scientific products Helps in Decision making purposes for issuance of warnings and verification.
Data Generation • Observations from sensor networks: satellites, radars, or ground-based stations • Model simulation data Source: NOAA, USA Jothiganesh
Data Management • Observatory data – Point data (Vector) • Satellite images as RASTER files (pixel based values) • Model data is always in Grid format. It can be either used directly as grid or point data format into GIS. • All point dataset can be made as surface using spatial interpolation techniques in GIS Jothiganesh
Data Analysis • Analyze patterns and trend • Spatiotemporal relationships among weather events • Verify forecast model output and observations data - Model validation • Evaluate Potential Impacts Jothiganesh
Why Weather and Geography? • Better visualization for better interpretation and understanding • Knowledge about influence of a parameter with respect to geography and period. • Help to make decisions for managing the impacts and influence of the event in sectors like Agriculture, Water resource, Drainage, Infrastructure, Transportation, Irrigation etc., Source: GOOGLE Jothiganesh
Weather & Geography Regional Forecast Map Disticts: Tan Ky, Yen Ti, Yen Thanh, Dien Chau, Do Luong, Ahn Son GIS Generates Value Added Information Nghe Province Jothiganesh
Weather &Geography When to transplant? When to plant? • Assist in analyzing the influence of a parameter (rainfall) over an element in a geographical area with respect to period • Especially use weather information's for Decision making purposes during various cropping stages. • Ploughing • Seedling • Transplanting • Harvesting Successful WMP ! When to store water? Jothiganesh
Hazard Thresholds • Heavy Rainfall? • Rainfall amount which can cause impacts for society • (Ex: 300mm/day or 200mm.hr) What is threshold? • Heavy Rainfall can cause? • Flood.. What it cause and Where? • Flood can affect? • Livelihood.. • Infrastructure… • Agriculture… • Etc., What is Impact? Jothiganesh What is the threshold value of rainfall in a geographic area to trigger an impact (hazard)?
Paddy field Case Hypothetical Scenario What? 200mm rainfall Sukothai and Nakon Ratchasima Province Where? When? 25 November 2009 Hazard functions More than 150mm in 24hours in November month on a paddy field creates flooding in the field and huge crop damage. • Impacts • Flooding in paddy field • Crop damage • Economic loss High (because it is at harvesting stage) Jothiganesh
Uttaradit Landslide Case Hypothetical Scenario Hazard functions More than 150mm rainfall may trigger Landslides in the Hazard Zones. Rainfall forecast • Impacts • Building collapse • Human Causalities • Affects vegetation pattern What? 200mm rainfall Uttaradit Province Where? When? 25 November 2009 Jothiganesh
Drainage Case Study Hypothetical Scenario Hazard functions More than 200mm in 3hours in Bangkok areas which has elevation less than 2m from MSL and creates Flood in roads • Impacts • Drainage problem • Flooding • Traffic What? 200mm rainfall Bangkok Province Where? When? 25 November 2009 Jothiganesh
Potential Impact? Sectors Infrastructure Agriculture Socio Economic Water Resource Transportation Jothiganesh Collateral Hazards Flooding, Landslide. What kind of Impact? Human affected Building damages Crop damages Livestock affected Livelihood activities stopped Transportation routes blocked Drainage pipes Health Issues
Elements at Risk? Jothiganesh Identifying the elements exposed (not Vulnerable) in the Hazard Zone, which is likely to have an impacts for a disaster event
How Decision Makers use Information? People in villages ____ Stay Alert People in villages_____ Evacuate to High Ground Stored Water in parcels has to be released in 24 hours in order to avoid flooding the next day, which may affect crops People who wish to travel through this road ___should avoid, because there are likely chances of flooding in the river near the road. Schools___ in this area will be closed. Jothiganesh Identify thresholds for your region Check forecast for your location and translate into easily understandable form
Weather and Exposure.. Tropical cyclone AILA-09 • Warnings included with risk index for population, landmarks, land cover, and utility infrastructure. Source: NOAA,GDACS
Weather and Exposure.. Affected Population Up to 24.35 million people can be affected by wind speeds of tropical storm strength or above. Affected Country (provinces) (population) Bangladesh (Khulna) (31312853), Bangladesh (Rajshahi) (29285383), India (Bihar) (91443350), India (West Bengal) (58245559). Source: NOAA,GDACS Affected Cities Affected Critical Infrastructures No nuclear plants affected No airports affected No ports affected No dams affected
Weather Plot Jothiganesh Rainfall Temperature Wind speed Mean Sea Level Wind Direction Ground Potential Height
Forecast Verification Observation & Forecast Comparison Grid Analysis Accuracy Probability of detection Jothiganesh
TRMM Rainfall Database Jothiganesh TRMM Database Development from 1999 to 2009 for East Timor
Flood Mapping Flooding in Central Vietnam Jothiganesh Flood Map of Srilanka
Exercise for Practice Jothiganesh The first exercise is to explore about the SAVGIS tool. Starting the software, Map explorer, Display the relations, Colour Shades, Symbols, Map layout etc., The second exercise is to import the TRMM data into GIS and generate rainfall surface map. The third exercise is to import the surface observatory rainfall data into GIS and generate rainfall surface map. The fourth exercise is to import the forecast data into GIS and plot weather forecast maps (rainfall, wind speed & wind direction). The fifth exercise is to identify the threshold & geographic area, make query in GIS to find elements at risk (population).
Thank you…. ? Questions Jothiganesh