Download
1 / 33
330 likes | 340 Views
Section 2.4. Slope Is a Rate of Change. Definition. The ratio of a to b is the fraction A unit ratio is a ratio written as with

E N D
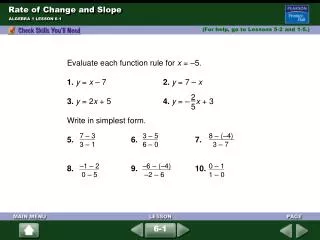
Section 2.4 Slope Is a Rate of Change
Definition The ratio of a to b is the fraction A unit ratio is a ratio written as with Suppose the sea level increases steadily by 12 inches in the past 4 hours as it approaches high tide. We can compute how much sea level change per hour by finding the unit ratio of the change in sea level to the change in time: Example Section 2.4 Slide 2 Definition Calculate the Rate of Change
Solution So, sea level increases by 3 inches per hours. This is an example of rate of change We say, “The rate of change of sea level with respect to time is 3 inches per hour.” The rate of change is constant because sea level increases steadily Section 2.4 Slide 3 Definition Calculate the Rate of Change
Examples Examples of rates of changes: The number of members of a club increases by five people per month. The value of a stock decreases by $2 per week. The cost of a gallon of gasoline increases by 10¢ per month. Section 2.4 Slide 4 Examples of Rates of Change Calculate the Rate of Change
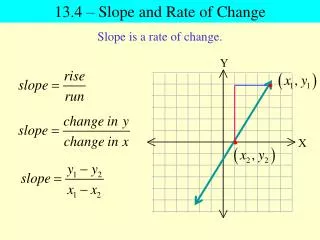
Definition Suppose that a quality y changes steadily form y1 to y2 as a quality x changes steadily from x1 to x2. Then the rate of change of y with respect to x is the ratio of the change in y to the change in x: If either quantity does not change steadily, then this formula is the average rate of change of y with respect to x. Section 2.4 Slide 5 Formula for Rate of Change and Average Rate of Change Calculate the Rate of Change
Example 1. The number of fires in U.S. hotels declined approximately steadily from 7100 fires in 1990 to 4200 in 2002. Find the average rate of change of the number of hotel fires per year between 1990 and 2002. Solution Section 2.4 Slide 6 Finding Rates of Change Calculate the Rate of Change
Solution Continued The average rate of change of the number of fires per year was about –241.67 fires per year. So, on average, the number of fires declined yearly by about 242 fires. Section 2.4 Slide 7 Finding Rates of Change Calculate the Rate of Change
Example Continued 2. In San Bruno, California, the average value of a two-bedroom home is $543 thousand, and the average value of a five-bedroom home is $793. Find the average rate of change of the average value of a home with respect to the number of bedrooms. Section 2.4 Slide 8 Finding Rates of Change Calculate the Rate of Change
Solution Consistent in finding signs of the changes Assume that number of bedrooms increases form two to five Assume that the average value increases from $543 thousand to $793 thousand Section 2.4 Slide 9 Finding Rates of Change Calculate the Rate of Change
Solution Continued Average rate of change of the average value with respect to the number of bedrooms is about $83.33 thousand per bedroom Average value increases by about $83.33 thousand per bedroom Section 2.4 Slide 10 Finding Rates of Change Calculate the Rate of Change
Properties Suppose that a quantity p depends on a quantity t: If p increases steadily as t increases steadily, then the rate of change of p with respect to t is positive If p decreases steadily as t increases steadily, then the rate of change of p with respect to t is negative Section 2.4 Slide 11 Increasing and Decreasing Quantities Calculate the Rate of Change
Example Suppose that a student drives at a constant rate. Let d be the distance (in miles) that the student can drive in t hours. Some values of t and d are shown in the table. 1. Create a scattergram. Then draw a linear model. Section 2.4 Slide 12 Comparing Slope with a Rate of Change Slope Is a Rate of Change
Solution Draw a scattergraph that contains the points 2. Find the slope of the linear model. Example Continued Solution Slope formula is , replacing y and x with d and t, respectively, we have: Section 2.4 Slide 13 Comparing Slope with a Rate of Change Slope Is a Rate of Change
Solution Continued Arbitrarily use the points (2, 120) and (3, 180) to calculate the slope: • The slope is 60 • Checks with calculations shown in the scattergraph Section 2.4 Slide 14 Comparing Slope with a Rate of Change Slope Is a Rate of Change
Example Continued Find the rate of change of distance per hour for each given period. Compare each result with the slope of the linear model. a. From b. From Solution • Calculate rate of change of the distance per hour from Section 2.4 Slide 15 Comparing Slope with a Rate of Change Slope Is a Rate of Change
Solution Continued The rate of change (60 miles per hour) is equal to the slope (60) For part b., calculate the rate of change of distance per hour from Section 2.4 Slide 16 Comparing Slope with a Rate of Change Slope Is a Rate of Change
Solution Continued The rate of change (60 miles per hour) is equal to the slope (60) Section 2.4 Slide 17 Comparing Slope with a Rate of Change Slope Is a Rate of Change
Property If there is a linear relationship between quantities t and p, and if p depends on t, then the slope of the linear model is equal to the rate of change of p with respect to t. Section 2.4 Slide 18 Slope is a Rate of Change Slope Is a Rate of Change
Property Suppose that a quantity p depends on a quantity t: If there is a linear relationship between t and p, then the rate of change of p with respect to t is constant. If the rate of change of p with respect to t is constant, then there is a liner relationship between t and p. Section 2.4 Slide 19 Constant Rate of Change Slope Is a Rate of Change
Example A company’s profit was $10 million in 2005 and has increased by $3 million per year. Let p be the profit (in millions of dollars) in the year that is t years since 2005. 1. Is there a linear relationship between t and p? Since the profit is a constant $3 million per year, the variables t and p are linearly related Solution Section 2.4 Slide 20 Finding a Model Finding an Equation of a Linear Model
Example Continued Find the p-intercept of a linear model Profit was $10 million in 2005 2005 is 0 years since 2005 This gives the ordered pair (0, 10) So, the p-intercept is (0, 10) 3. Find the slope of the linear model. Solution Example Continued Section 2.4 Slide 21 Finding a Model Finding an Equation of a Linear Model
Solution Rate of change of profit per year is $3 million per year So, the slope of the linear model is 3 Find an equation of the linear model. Since p-intercept is (0, 10) and slope is 3, the linear model is: Example Continued Solution Section 2.4 Slide 22 Finding a Model Finding an Equation of a Linear Model
Graphing Calculator Verify the ordered pair (0, 10) Verify that as the input increases by 1, the output increases by 3 Section 2.4 Slide 23 Finding a Model Finding an Equation of a Linear Model
Definition We perform a unit analysis of a model’s equations by determining the units of the expression on both sides of the equation. The simplified units of the expressions on both sides of the equation should be the same. Section 2.4 Slide 24 Definition: Unit Analysis Unit Analysis of a Linear Model
Example A driver fills her car’s 12-gallon gasoline tank and drives as a constant speed. The car consumes 0.04 gallon per mile. Let G be the number of gallons of gasoline remaining in the tank after she has driven d miles since filling up. 1. Is there a linear relationship between d and G? Rate of change is a constant –0.04 gallons per minute, so d and G are linearly related Solution Section 2.4 Slide 25 Finding a Model Unit Analysis of a Linear Model
Example Continued 2. Find the G-intercept of a linear model. Tank is full at 12 gallons: ordered pair (0, 12) 3. Find the slope of the linear model. Gasoline remaining in the tank with respect to distance traveled is: Solution Example Continued Solution Section 2.4 Slide 26 Finding a Model Unit Analysis of a Linear Model
Example Continued 4. Find the equation of the linear model. Since p-intercept is (0, 12) and slope is –0.04, the linear model is: 5. Perform a unit analysis of the equation Here a unit analysis on the equation : Solution Example Continued Solution Section 2.4 Slide 27 Finding a Model Unit Analysis of a Linear Model
Solution Continued We use the fact that = 1 to simplify the units of the expression on the right-hand side of the equation: Units on both sides are gallons: Suggesting correct Section 2.4 Slide 28 Finding a Model Unit Analysis of a Linear Model
Example Yogurt sales (in billions of dollars) in the United States are shown in the table for various years. Let s be yogurt sales (in billions of dollars) in the year that is t years since 2000. A model of the situation is: 1. Use a graphing calculator to draw a scattergram and the model in the same viewing window. Check whether the line comes close to the data. Section 2.4 Slide 29 Analyzing a Model Two Variables That Are Approximately Linearly Related
Solution Draw in the same screen using a graphing calculator See Sections B.8 and B.10 2. What is the slope of the model? What does it mean in this situation? Example Continued Section 2.4 Slide 30 Analyzing a Model Two Variables That Are Approximately Linearly Related
Solution which is of the form Since m is the slope, the slope is 0.17 Sales increase by 0.17 billion dollars per year 3. Find the rates of change in sales from one year to the next. Compare the rates of change with the results in Problem 2. Example Continue Section 2.4 Slide 31 Analyzing a Model Two Variables That Are Approximately Linearly Related
Solution Rates of change are shown in the table – all are close to 0.17 Section 2.4 Slide 32 Analyzing a Model Two Variables That Are Approximately Linearly Related
Example Continue 4. Predict the sales in 2010. Substitute the input of 10 for t: If two quantities t and p are approximately linearly related, and if p depends on t, then the slope of a reasonable linear model is approximately equal to the average rate of change of p with respect to t. Solution Property Section 2.4 Slide 33 Analyzing a Model Two Variables That Are Approximately Linearly Related