Download
1 / 26
280 likes | 592 Views
4.4 Find Slope and Rate of Change. Students will find the slope of a line and interpret slope as a rate of change. Students will do assigned homework. Students will study vocabulary words. 1. y + 3. 1. –. x 5. –. 3. 1 y. –. 2. x 6. –. 3. –. 4.

E N D
4.4 Find Slope and Rate of Change Students will find the slope of a line and interpret slope as a rate of change. Students will do assigned homework. Students will study vocabulary words.
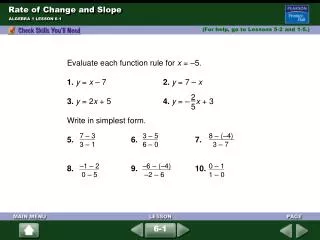
1. y+ 3 1 – x 5 – 3 1y – 2. x 6 – 3 – 4 Lesson 4.4, For use with pages 234-242 Evaluate and simplify the ratios when x=2 and y= –2. ANSWER ANSWER
Lesson 4.4, For use with pages 234-242 3.A cross-countryskier traveled 14 miles in 3.5 hours. Use the formula d=rt where d is distance, r is rate, and t is time, to find the average rate of speed. ANSWER 4 mi/h
x-int: 1, y-int: –3 ANSWER Daily Homework Quiz For use after Lesson 4.3 1. Find thex-intercept and they-intercept of thegraph of 3x – y = 3.
ANSWER (0, 7), (6, 4), (10, 2), (14, 0) Daily Homework Quiz For use after Lesson 4.3 2. A recycling company pays $1 per used ink jet cartridge and $2 per used laser cartridge. The company paid acustomer $14. This situation is given by x + 2y = 14 wherexis the number of ink jet cartridges andythe number of laser cartridges. Use intercepts to graph the equation. Give four possibilities for the number of each type of cartridge that could have been recycled.
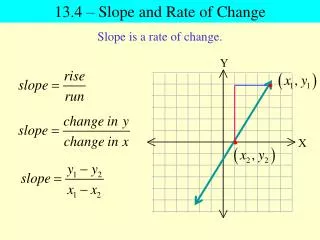
6– 2 2– (–4) 2 4 3 6 y2 –y1 m = x2 – x1 = = = EXAMPLE 1 Find a positive slope Find the slope of the line shown. Let (x1, y1) = (–4, 2) = (x2, y2) = (2, 6). Write formula for slope. Substitute. Simplify.
ANSWER 3 Write an equation from a graph EXAMPLE 2 GUIDED PRACTICE for Example 1 Find the slope of the line that passes through the points. 1. (5, 2) and (4, –1)
ANSWER 1 2 Write an equation from a graph for Example 1 GUIDED PRACTICE Find the slope of the line that passes through the points. 2. (–2, 3) and (4, 6)
3. ( , 5) and ( , –3) ANSWER 2 9 1 2 2 Write an equation from a graph for Example 1 GUIDED PRACTICE Find the slope of the line that passes through the points.
– 6 –1– 5 3 = 6– 3 –2 = = y2 –y1 m = x2 – x1 EXAMPLE 2 Find a negative slope Find the slope of the line shown. Let (x1,y1) = (3, 5) and (x2, y2) = (6, –1). Write formula for slope. Substitute. Simplify.
4– 4 = 4– (–2) 0 0 = = y2 –y1 6 m = x2 – x1 EXAMPLE 3 Find the slope of a horizontal line Find the slope of the line shown. Let(x1, y1) = (–2, 4) and (x2,y2) = (4, 4). Write formula for slope. Substitute. Simplify.
– 4 1– 5 0 = 3– 3 = y2 –y1 m = x2 – x1 ANSWER Because division by zero is undefined, the slope of a vertical line is undefined. EXAMPLE 4 Find the slope of a vertical line Find the slope of the line shown. Let(x1,y1) = (3, 5)and(x2, y2) = (3, 1). Write formula for slope. Substitute. Division by zero is undefined.
ANSWER undefined Write an equation from a graph EXAMPLE 2 for Examples 2, 3 and 4 GUIDED PRACTICE Find the slope of the line that passes through the points. 4. (5, 2) and (5, –2)
ANSWER 0 Write an equation from a graph for Examples 2, 3 and 4 GUIDED PRACTICE Find the slope of the line that passes through the points. 5. (0, 4) and (–3, 4)
ANSWER –2 Write an equation from a graph for Examples 2, 3 and 4 GUIDED PRACTICE Find the slope of the line that passes through the points. 6. (0, 6) and (5, –4)
EXAMPLE 5 Find a rate of change INTERNET CAFE The table shows the cost of using a computer at an Internet cafe for a given amount of time. Find the rate of change in cost with respect to time.
change in cost = change in time 3.5 = 14– 7 = 4– 2 7 = 2 ANSWER The rate of change in cost is $3.50 per hour. EXAMPLE 5 Find a rate of change SOLUTION Rate of change
7. EXERCISE The table shows the distance a person walks for exercise. Find the rate of change in distance with respect to time. ANSWER 0.05 mi/min for Example 5 GUIDED PRACTICE
COMMUNITY THEATER A community theater performed a play each Saturday evening for 10 consecutive weeks. The graph shows the attendance for the performances in weeks 1, 4, 6, and 10. Describe the rates of change in attendance with respect to time. EXAMPLE 6 Use a graph to find and compare rates of change
108 –28 232 – 124 = 1 4 – 3 2 204 – 232 = 4 6 – 72 – 204 –132 = 6 10 – 4 ANSWER Attendance increased during the early weeks of performing the play. Then attendance decreased, slowly at first, then more rapidly. EXAMPLE 6 Use a graph to find and compare rates of change SOLUTION Find the rates of change using the slope formula. =36 people per week Weeks 1–4: Weeks4–6: = –14people per week =–33people per week Weeks 6–10:
COMMUTING TO SCHOOL A student commutes from home to school by walking and by riding a bus. Describe the student’s commute in words. EXAMPLE 7 Interpret a graph
EXAMPLE 7 Interpret a graph SOLUTION The first segment of the graph is not very steep, so the student is not traveling very far with respect to time. The student must be walking. The second segment has a zero slope, so the student must not be moving. He or she is waiting for the bus. The last segment is steep, so the student is traveling far with respect to time. The student must be riding the bus.
ANSWER Sample answer: The attendance did not decrease as rapidly between weeks 10 and 12. 8. WHAT IF?How would the answer to Example 6 change if you knew that attendance was 70 people in week 12? EXAMPLE 7 for Examples 6 and 7 Interpret a graph GUIDED PRACTICE
9. WHAT IF?Using the graph in Example 7, draw a graph that represents the student’s commute from school to home. ANSWER EXAMPLE 7 for Examples 6 and 7 Interpret a graph GUIDED PRACTICE