Download
1 / 28
280 likes | 437 Views
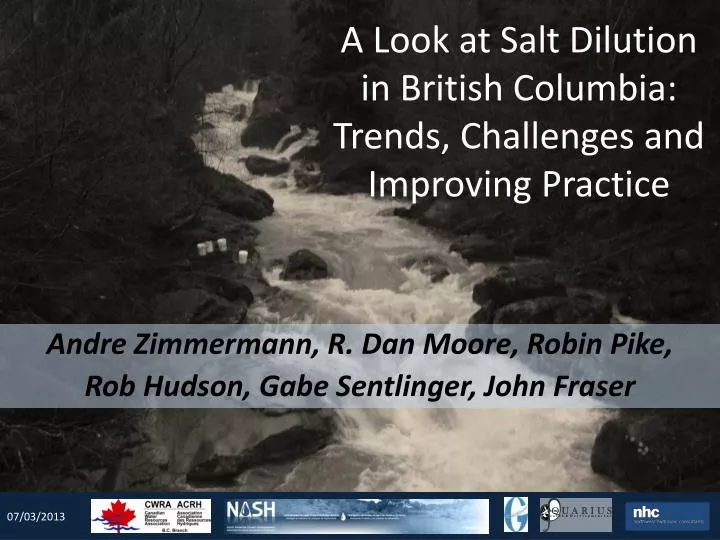
A Look at Salt Dilution in British Columbia: Trends, Challenges and Improving Practice. Andre Zimmermann , R. Dan Moore, Robin Pike , Rob Hudson, Gabe Sentlinger , John Fraser. Presentation Overview. Why use salt dilution approach? Overview of technique Who is using salt dilution?

E N D
A Look at Salt Dilution in British Columbia: Trends, Challenges and Improving Practice Andre Zimmermann, R. Dan Moore, Robin Pike, Rob Hudson, Gabe Sentlinger, John Fraser
Presentation Overview Why use salt dilution approach? Overview of technique Who is using salt dilution? How much is it being used? Problems that can occur Best practices Permitting and dosing guidance for BC
Why is salt dilution being used in BC • Unsafe to enter channel • ADCP not going to work • Can be faster than velocity area • Can work in low flow boulder bed channels that do not have a defined velocity profile (11-14 m3/s) Other techniques not suitable
Why is salt dilution being used in BC Other techniques not suitable Increased research in steep streams Run-of-the-River Hydro projects Technique is becoming more widely accepted Velocity measured with technique can accurately represent mean depth
Compare salt to area-velocity 20 paired measurements On average salt measured 0.9% less Q The values ranged between -15% and + 27% The 95% confidence interval ranged between -4.6% and 6.4%
Overview of technique • Known amount of salt or brine is dumped into a turbulent portion of the river • Mass of dry salt or volume of brine is recorded • Can be injected as: • a brine (better) • dry (can be problematic) • Conductivity probe downstream records passage of salt wave • Area under curve is used to quantify amount of salt that passes
Overview of technique • Relationship between dry salt and conductivity response is determined (CF.T) • Known amount of dry salt is mixed with known amount of distilled water or stream water • This solution is then typically diluted to about 1g/L concentration • The conductivity of a known amount of the stream water is then measured • Then a small amount (e.g. 5 ml) of the ≈ 1g NaCl/L solution is added to the stream water and the conductivity measured again. • Repeated until the maximum observed conductivity is reached and line consists of 4-8 points • Slope = CF.T
Overview of technique • Calculate Q • If brine is used mass is replaced with volume of solution injected and CF.T becomes k • k is determined by: • Making a secondary solution by adding 5-10 ml of brine (primary solution) to 1 Liter of stream water • Then 5-10 ml of secondary solution are added to stream water in increments, and slope (k) is determined
Who is using Salt Dilution Academics Government Consultants Independent Power Producers BC Hydro (indirectly through consultants) Municipalities (indirectly through consultants)
How much is dillution being used • Estimated that 300-500 dilution measurements are made per year • Most are made for IPP industry • Could be a thousand • WSC in BC makes about 2000-3000 traditional measurements per year
Problems that can occur Incorrect temperature compensation Poor mixing Inappropriate measuring devices Incorrect use of equipment Use of distilled water for calibration solution (dry salt only)
Distilled water correction Need to account for the conductivity depression resulting from preparing the calibration solution with distilled water
Distilled water correction Need to account for the conductivity depression resulting from preparing the calibration solution with distilled water Reduction greatest if the background conductivity of the stream water is high The predicted depression in electrical conductivity by adding a known volume of distilled water can be derived from a two-component mixing model: EciStream water EC EcdwDistilled water EC ECmix Mixed water EC Vi is the initial volume of stream water Vdw is the volume of distilled water added. The resulting depression of conductivity (ΔEC) can be estimated by rearranging the above terms
Example add 0.005 L of distilled water with a conductivity of 2.2 µS/cm to an initial volume of 1 L water with a background conductivity of 172.1 µS/cm The resulting reduction in conductivity would be approximately 0.9 µS/cm This can result in a 7 % increase in the CF.T, which results in a 7 % decrease in Q
Does CF.T depend on background conductivity? • Hongve (1987) suggests it does • But if you apply the distilled water correction to the data: correction = slope of trend; so no trend • Szeftel (2011) suggests it does • But also used distilled water
Does CF.T depend on background conductivity? NHC data from 2011-2013 based on 7 coastal sites
Does CF.T depend on background conductivity? NHC data from 2011-2013 based on 7 coastal sites No significant trend
Does CF.T depend on background conductivity? • Hongve (1987) suggests it does • But if you apply the distilled water correction to the data • correction = slope of trend; so no trend • Szeftel (2011) suggests it does • But also used distilled water • NHC data after correcting for dilution suggests no trend • Others observe weak trend • Ongoing area of research
Does CF.T depend on background conductivity? CF.T does depend on temperature compensation used May vary for different probes Need to demonstrate that it is constant, or at least predictable for auto gauge approach
Best Practices • Informal group developing best practices • Metadata requirements • Pre trip planning • Sensor calibration (conductivity and temperature) • Inspect equipment (vessels, scales and pipettes) • Preparation of calibration solution • Temperature compensation • Measurement of pulse (frequency, target amplitude) • Quantification of uncertainty
Permitting in BC • Depends on water body, defined values present and if any species are present that show sensitivities to NaCl • No site specific authorization is required under the Environmental Management Act as long as water quality guidelines/objectives for the most sensitive receptors are met. • http://www.env.gov.bc.ca/wat/wq/ • There is a general prohibition in EMA to not cause pollution, where pollution is defined as • “the presence in the environment of substances or contaminants that substantially alter or impair the usefulness of the environment” • However, permitting agencies (e.g., MOE) will need to be consulted in cases where water quality objectives or guidelines might be exceeded and/or where endangered and special concern species are present, local WQ objectives are absent and blanket WQG’s do not provide species protection • Other jurisdictional permissions may need to be sought (e.g., Federal jurisdictions over fish habitat, working in a Provincial Park, public concerns in community watersheds or drinking water supplies)
Dosing Guidance • There are six key questions that should be addressed prior to determining appropriate salt dosage. • What is the most sensitive designated end use (drinking water, irrigation, habitat)? (Select appropriate WQG Chloride level) • Are there species present that have sensitivities below the WQG’s? (If present, revise dosing/ target chloride level and seek permitting authority advise) • Do watershed specific water quality objectives exist? (revise dose) • Is background stream conductivity elevated? Beyond WQG’s? • Is the receiving environment sensitive to repeated chloride loading? • How much room is there between the background Specific Conductance and WQG or most sensitive species’ Chloride level? (Need to ensure there sufficient room to stay below WQG’s and still get a viable trace)
Dosing Guidance • Most hydrologists lack specialized equipment to determine chloride levels in the field • Specific conductance can be used as a proxy to determine qualitative chloride background and potential maximum peak induced conductivity. • Assumes conductivity is a function of chloride (could be other ions (e.g., Ca and Mg)) • This is a precautionary approach • We can calculate potential maximum peak induced conductivity, where: • ECbg = specific conductance, background • ECwqg =equivalent specific conductance of Water Quality Guideline • Dose Range = maximum induced specific conductance over background • Dose Range = ECwqg – Ecbg
Example 1 Stream with medium level background electrical conductivity Freshwater aquatic life is most sensitive designated use No permits or permissions required WQG is 150 mg Cl/L (source?) Background stream specific conductance = 165 µS/cm To convert WQG in mg Cl/L we simply divide the guideline value by 0.6067 to get NaCl mass. This divisor is used because NaCl is 39.34% Na, and 60.67% Cl E.g., WQG is 150 mg Cl/L = [150/0.6067= 247.3 mg NaCl/L] To convert the mass of salt into an equivalent specific conductance we essentially double the value to express it is µS/cm. This is because 1 mg of NaCl in 1 L of water = 2.14 µS/cm change from background E.g., ECwqg =247* 2 = [494 µS/cm] The maximum targeted peak induced specific conductance above background is calculated as: Dosing range= ECwqg – ECbg Background Stream EC: 165 µS/cm 494 – 165 = 329 µS/cm (maximum induced EC over background)
Example 2 Measurement in a system with a species sensitive to low levels of chloride (below Provincial Water Quality Guidelines) Water quality objectives are being drafted but not yet available The water quality guideline in this case is replaced by the most conservative effect level per sensitive species present Most sensitive species is affected at 24 mg Cl/ L – (24 ÷ 0.6067 = 39.6 mg NaCl/L equivalent) Stream water background specific conductance = 37 µS/cm In this instance, the lowest species level effect replaces the WQG The equivalent species effect level in µS/cm is calculated by doubling 39.6 mg NaCl/ L = 79.2 µS/cm] Dosing range = 79.2 – 37 = 42.2 µS/cm (maximum induced EC over background)
Guidelines for the Selection Starting Dose • There have been many different recommendations with respect to the amount of salt (kg) required per volume of streamflow (cms), and starting doses • Maximum peaks from background of 40-50 µS/cm are generally sufficient • In low conductivity streams (< 20 µS/cm) 10 µS/cm increase is likely fine • Moore (2005) recommends approximately 165 – 200 g/cms • Hudson and Fraser (2005) recommend 500 g-1000 g/cms • Advisable to start out using a quarter to half the recommended dosing and work progressively upwards to stronger concentrations. • The objective is to stay well below the BC Water quality guidelines for chloride for the most sensitive designated use while achieving a sufficiently strong trace • Example 1 has a lot of room between the water quality guideline and the background specific conductance • Example 2 illustrates a very narrow margin between the background specific conductance and the level at which the most sensitive species is affected • More conservative approach warranted to ensure peak of the salt wave does not exceed 42 µS/cm above background (79.2 µS/cm)