Download
1 / 15
150 likes | 256 Views
Climate Change Declaration Reporting. Jenny Cassells Sector Manager – Carbon Trust Scotland. Agenda. Local Authority carbon performance Section 2 overview Section 2 reporting elements Recommendations for reporting structure. Carbon Trust review.

E N D
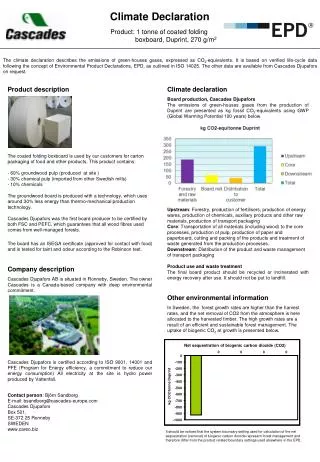
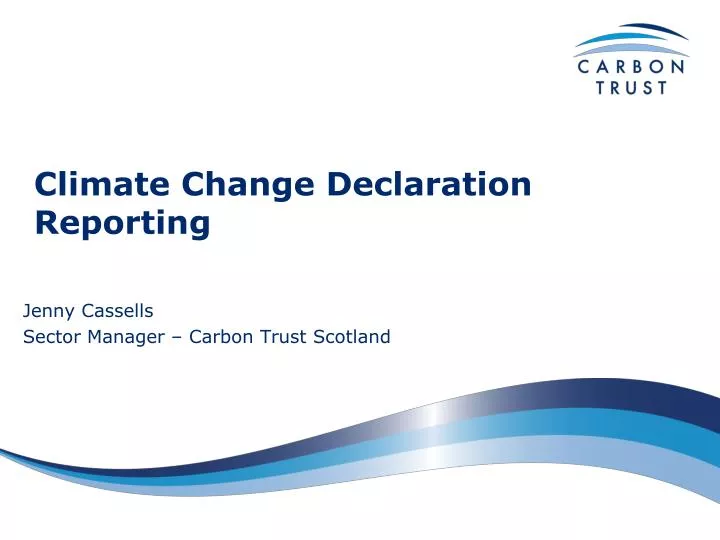
Climate Change Declaration Reporting Jenny Cassells Sector Manager – Carbon Trust Scotland
Agenda • Local Authority carbon performance • Section 2 overview • Section 2 reporting elements • Recommendations for reporting structure
Carbon Trust review • Through aggregation of 138 carbon management plans we have created a baseline for public sector emissions in Scotland of 3.4 MtCO2e • Based on plans with variable baseline years but predominantly 2008 or 2009 • Plans reviewed cover 75% of bodies by number, and we estimate ~90% by emissions • Local authorities make up 63% of the baseline, with NHS and Higher Education accounting for 17% and 11% respectively • Buildings emissions are the largest source, at 67%, with transport and waste accounting for 13% and 18% • Buildings emission account for over 80% of emissions in all sectors apart from Local Authorities and Emergency Services where waste and transport respectively account for over 20% • We calculate that the traded sector accounts for about 40% of public sector emissions • Excluding transport and waste to give a baseline suitable for RPP2 reduces the total to 0.98Mt • Local authorities account for 62% of this baseline • Buildings emissions make up 98% of this baseline
Aggregation of the 138 CMPs gives a baseline for public sector emissions of 3.4 Mt. Local authorities dominate the sectoral breakdown; buildings emissions are the largest source, followed by waste Emissions Baseline by Sector Emissions Baseline by Source Emergency Services117kt3.4% Street lighting 83kt2% Central Gov’t145kt4.3% Water7kt; 0.2% Other: 10kt; 0.3% Further Education56kt1.6% Higher Education387kt11% Waste591kt17% Transport434kt13% Local Authorities2,134kt63% NHS572kt17% Buildings2,286kt67% Total Emissions3,411kt CO2e Total Emissions3,411kt CO2e
Local authorities account for around half of the total identified carbon savings in Close Out Total: 688 ktCO2 Total: 6,259 ktCO2 Number of recommendations: 4,986 Note: Total includes traded and non-traded measures; Building shell = fabric, building management systems and building electricity & water distribution systems Source: Close Out; Carbon Trust analysis
The spread of abatement across project status is fairly even though higher education have the highest abatement from existing projects Identified Abatement by Status of Intervention and Sector(Total) Medium to long term Planned but not funded PercentofIdentifiedAbatement Planned & funded Existing Note: Total includes both traded and non-traded measures Source: Carbon Management Plans; Carbon Trust analysis
Behaviour measures were identified as a major source of potential abatement across most sectors; NHS have identified more renewables than other sectors Identified Abatement by Category of Intervention and Sector(Total) Water heating Water & wastewater Waste Transport Renewables Office closure / relocation PercentofIdentifiedAbatement Lighting HVAC Fabric Behaviour Appliances / IT Note: Total includes both traded and non-traded measures Source: Carbon Management Plans; Carbon Trust analysis
Section 2 overview • 29 reports submitted at the point of review • Corporate emissions • Scope 1 and 2 mainly • All reports reviewed contributed information to section 2 – no blanks but varying detail was apparent • Most used data format already in place • 1 or 2 decided to use a completely different reporting format • Did they convey the good reduction work being done - yes
Review observations • Baseline • Some did not provide • Must established the year as well as provide the data • Targets • State the target year for total reduction • State the target • Reportable years • Report on intervening years • Report on most recent full year
Review observations cont. • Data to be reported • Report separate emission sources • Should scope be mentioned • Reduction figures • Provide numerical figure • Provide percentage • Provide in absolute form – not net or weather adjusted • Reduction projects • Mentioned in narrative form • Tabulated – feasibility metrics • Maximum number of examples per section
Review observations • Carbon conversion factors • Follow DECC guidelines on retroactive back casting • Format • Should Section 2 be more prescriptive in format • Use of individual comment boxes • Should there be a word limit on project description • Emission scopes • Should Scope 3 emissions be reported • Traded and non traded emissions • For future reference • Does this have a bearing on reporting to Government in the future
Review observations • Report length • Shortest report was 5 pages and longest was 34 pages can make for difficulties in review • Is there an optimum
Conclusions • Improve parity • Simplify the reporting structure • Optimise reporting length • Follow the format • Specify key topics for comment • Report auditing • Key support • Training
Thank you Questions?