Download

1 / 29
290 likes | 382 Views
Characteristics in Flight Data. Characteristics in Flight Data Estimation with Logistic Regression and Support Vector Machines. ICRAT 2004 Claus Gwiggner, LIX, Ecole Polytechnique Palaiseau Gert Lanckriet, EECS, University of California, Berkeley. Flow Management and Planning Differences.

E N D
Characteristics in Flight Data Characteristics in Flight Data Estimation with Logistic Regression and Support Vector Machines ICRAT 2004 Claus Gwiggner, LIX, Ecole Polytechnique Palaiseau Gert Lanckriet, EECS, University of California, Berkeley
Flow Management and Planning Differences Planning Differences • Time slots are distributed among aircraft to avoid congestion • In reality, delays, re-reroutings, etc. lead to missed time slots • Not the same number of aircraft than planned arrive in sectors: • safety, lost capacity
Related Work • Factors/Causes [ATFM Study, PRR] • Slot adherence, flight plan quality, in-flight change of route, .... • Simulations [Ky, Stortz] • Random noise on departure times • Reactionary Delay [Toulouse Study] • microscopic model of departure times
Unknown • Real situation at sector entries • interplay of factors • compensations of delays • ...
Program • Problem Formulation • Simple Characteristics • Binary Classification • Conclusion • Future Work
Planning Differences Planning Differences = Regulated Demand – Real Demand
General Problem Formulation • Find 'regularities' of planning differences, useful to improve the current planning procedure • Why? Safety, suboptimal used capacity • How? • MACRO approach: relations between flows, not single deviations from flight plans • Daily basis, not extreme situations • How? Data analysis • 141 days of week-day data
Today's Question • Are planning differences of different sectors the 'same'? • if yes: any model can be greatly simplified • if no: what are the differences? • Difficulty • 24 dimensions: one variable for each hour
Comparison of Planning Differences • No visible regularities in both sectors ...
Mean and Standard Deviation ...but similar mean and standard deviation over the time
Hypothesis Tests • H0: same underlying distribution ... • reject on 1 % level • assumes that statistical properties do not vary over time • .... but what are the characteristics? • e.g. 'if high peaks at noon => sector 1'? • Find a rule that tells whether a sequence of values belongs to sector 1 • Classification problem
Geometric 'on which side of the boundary lies the new item?' Support Vector Machines (Binary) Classification • Probabilistic • 'what is the probability that a new item belongs to sector 1?' • Logistic Regression
Comparison • Linear Logistic Regression vs SVMs • linear vs non-linear • simple vs mathematically sophisticated • traditional vs state-of-the-art • probabilistic vs geometric • Common points [Hastie et. al 2003], [Friedman 2003] • SVM estimator of class probabilities • logistic regression induces linear boundaries
Experiments on ... • Data from 4 sectors in Upper Berlin airspace • Raw Data (random permutations) • Data where number of instances in both classes are balanced • In total 8 experiments conducted
Model Selection • Report Estimated Prediction Error (EPE) • Model Selection: • Cross-Validation [Stone 1974] • Wilcoxon-Mann-Whitney Test
Parameters of SVMs • Kernel functions • Linear, Gauss, Poly, Linear CN, Gauss CN, Poly CN • Kernel parameters • Cost Function • 1 Norm, 2 Norm • In total over 800 combinations possible • best one estimated by cross validation
Summary • characteristics in high dimensional data • comparison of a very simple and a very complicated classification method
Conclusions • There are systematic differences between different sectors • SVMs do not promise major improvement • no more than 4% better than logistic regression • Linear Prediction is possible • Expected prediction errors around 15 %
Future Work • (black box) prediction not satisfactory • Better understanding of the underlying processes • reasons for the differences • model of the probability distribution of planned traffic and realized traffic
Thanks for your attention! Questions ?
Results • Is Week End?
Known: Causes for Planning Differences Departure Slot adherence Inconsistent profile Regulations too late Weekday, Season Weather Slot tolerance window Missing flight plans Incorrect flight plan information time In flight change of route Priorities: Very High High Medium Unknown Source: Independent Study for the Improvement of ATFM, Final Report, 2000 # over-deliveries CASA implementation
Little known: Dynamics of Planning Differences Sector 1 Sector 2 'Error' Propagation ... Sector n X: time Y: Number of planning differences Related Work: Simulation studies, reactionary delay studies
Summary Motivation • Are planning differences unpredictable? • Or are there hidden 'regularities'?
Possible Research Questions • Propagation over the network • Dependence on traffic density, sector complexity, ... • ... • Characteristics • Comparison of different sectors
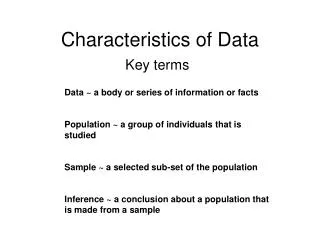
Notation • A sector is represented as a vector of 24 variables, one for each hour • An instance is a value for this vector • An instance belongs to class 1 or -1; dependent on the sector from which it was drawn
Binary Classification • Given: • Instances from sectors 1 and -1 • Question: • a rule to decide for a new instance to which sector it might belong • Example: • if 'high peaks at noon' then class 1 • Decision trees
Geometric and Probabilistic Approaches example: Instances are 2 dimensional • Geometric • Instances are points in Euclidean space • Rules are class boundaries • Problem: overlapping classes • Probabilistic • Classes have underlying probability distribution • Rules are class-probabilities • Problem: which distribution?