Download
1 / 18
180 likes | 184 Views
STATUS of the AURIGA DETECTOR. Giovannni A. Prodi for the AURIGA Collaboration. performances achieved by AURIGA during 2004 see poster on “AURIGA characterization”. AURIGA run II : upgrades. new mechanical suspensions: attenuation > 360 dB at 1 kHz FEM modelled.

E N D
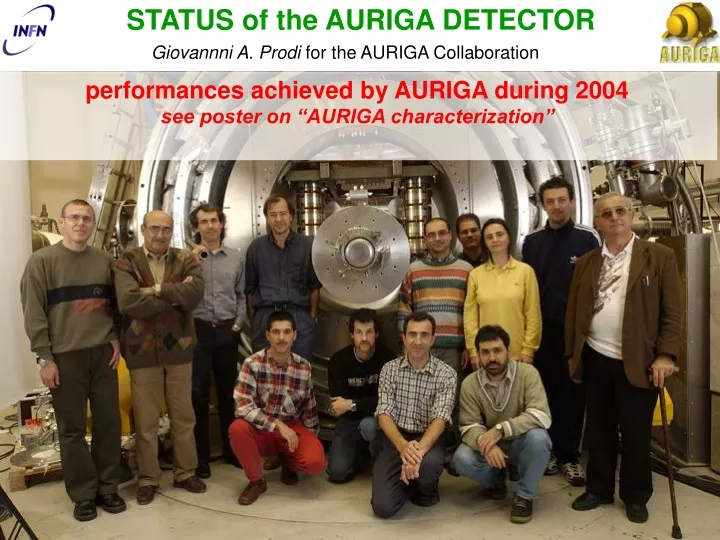
STATUS of the AURIGA DETECTOR Giovannni A. Prodi for the AURIGA Collaboration performances achieved by AURIGA during 2004 see poster on “AURIGA characterization”
AURIGA run II: upgrades • new mechanical suspensions: • attenuation > 360 dB at 1 kHz • FEM modelled • three resonant modes operation: • two mechanical modes • one electrical • new data analysis and data acq.: • C++ object oriented code • frame data format • Monte Carlo software injections • improved noise matching algorithm • selectable templates
AURIGA run II: upgrades ■ Two-stage SQUID: Tn(h) = 97 + 78T(K) ● Single stage SQUID: Tn(h) = 1280 +300T(K) Noise Temperature (h) Temperature (K) • three resonant modes operation: • two mechanical modes • one electrical mode • transducer bias field 8 MV/m • new SQUID amplifier : • double stage SQUID • 650 energy resolution at 4.5 K in the detector
calibration Measurement of the mechanical transfer function of the bar-transducer system Measurement of the impedance seen by the SQUID amplifier input
raw data PSD three resonant modes 1 2 3 Frequency [Hz] Fit data with noise model to estimate the noise parameters
Monday morning Temperatures of resonant modes Detector operating at 4.5 K: the 3 modes achieve the thermal noise level mode 1 mode 2 mode 3 T [ K ] date 13-15 Nov. 2004
… months of diagnostic measurements and noise hunting … Shh sensitivity (1) initial operation at 4.5 K started on Dec. 24th 2003 unmodeled spurious noise peaks within the sensitivity bandwidth • not related to the dynamical linear response ofthe detector • non gaussian statistics • related to mechanical external disturbances • up-conversion of low frequency noise
Shh sensitivity (2) one-sided Shh Very good agreement with noise predictions all these noise sources will scale with temperature
integration of additional mechanical suspension Progress toward a quieter operation
H [Hz-1] 10-21 – [Hz-1] typical sensitivity and efficiency to bursts Nov 13-15, 2004
cumulative event rate above threshold false alarm rate [hour-1] after vetoing epoch vetoes (50% of time) vetoed glitches Remaining events after vetoing candidate events Amplitude distribution of events Nov. 13-14, 2004
False alarm rate vs time events with SNR>4 Duty cycle left after vetoing 15min bins candidate events and duty cycle Nov. 13-14, 2004
LHe4 vessel Al2081 holder Electronics wiring support Main Attenuator Thermal Shield Sensitive bar Compression Spring Transducer AURIGA II run
AURIGA II run (mid 2003):upgrades new mechanical suspensions: attenuation > 360 dB at 1 kHz FEM modelled new capacitive transducer: two-modes (1 mechanical+1 electrical) optimized mass new amplifier: double stage SQUID 200 energy resolution new data analysis: C++ object oriented code frame data format