Download
1 / 1
10 likes | 127 Views
Microarray Analyses in Bladder Cancer Cells: Inhibition of hTERT Expression Down-regulates EGFR S. Fuessel 1 , K. Kraemer 1 , U. Schmidt 1 , A. Herr 2 , O.W. Hakenberg 1 , A. Meye 1 , M.P. Wirth 1 1 Department of Urology, 2 Institute of Clinical Genetics, Medical Faculty,

E N D
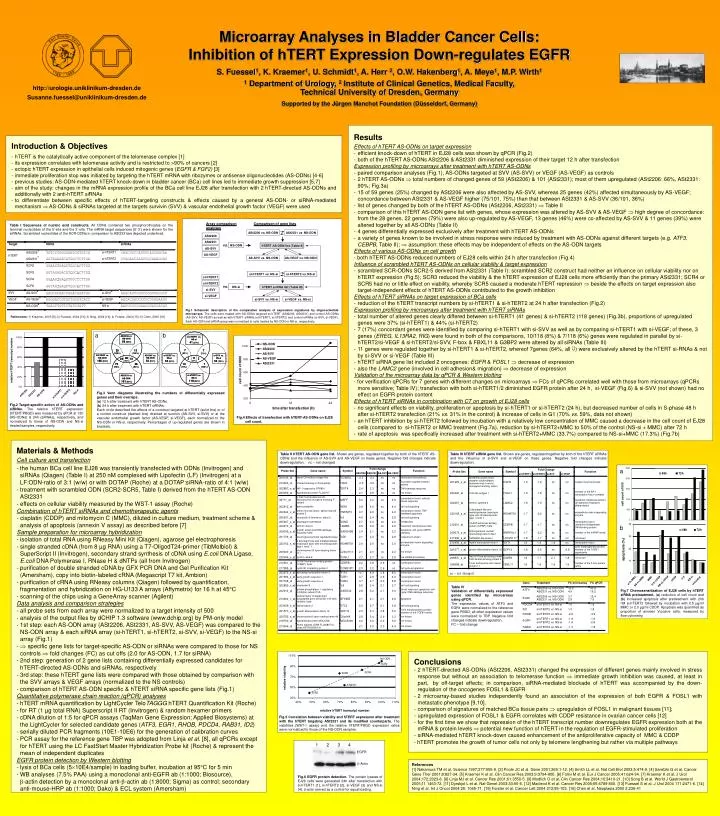
Microarray Analyses in Bladder Cancer Cells: Inhibition of hTERT Expression Down-regulates EGFR S. Fuessel1, K. Kraemer1, U. Schmidt1, A. Herr 2, O.W. Hakenberg1, A. Meye1, M.P. Wirth1 1 Department of Urology, 2 Institute of Clinical Genetics, Medical Faculty, Technical University of Dresden, Germany Supported by the Jürgen Manchot Foundation (Düsseldorf, Germany) http://urologie.uniklinikum-dresden.de Susanne.fuessel@uniklinikum-dresden.de • Introduction & Objectives • hTERT is the catalytically active component of the telomerase complex [1] • its expression correlates with telomerase activity and is restricted to >90% of cancers [2] • ectopic hTERT expression in epithelial cells induced mitogenic genes (EGFR & FGF2) [3] • immediate proliferation stop was initiated by targeting the hTERT mRNA with ribozymes or antisense oligonucleotides (AS‑ODNs) [4-6] • previous studies: AS-ODN-mediated hTERT knock-down in bladder cancer (BCa) cell lines led to immediate growth suppression [5,7] • aim of the study: changes in the mRNA expression profile of the BCa cell line EJ28 after transfection with 2 hTERT-directed AS-ODNs and additionally with 2 anti-hTERT siRNAs • to differentiate between specific effects of hTERT-targeting constructs & effects caused by a general AS-ODN- or siRNA-mediated mechanism AS-ODNs & siRNAs targeted at the targets survivin (SVV) & vascular endothelial growth factor (VEGF) were used • Results • Effects of hTERT AS-ODNs on target expression • efficient knock-down of hTERT in EJ28 cells was shown by qPCR (Fig.2) • both of the hTERT AS-ODNs ASt2206 & ASt2331 diminished expression of their target 12 h after transfection • Expression profiling by microarrays after treatment with hTERT AS-ODNs • paired comparison analyses (Fig.1), AS-ODNs targeted at SVV (AS-SVV) or VEGF (AS-VEGF) as controls • 2 hTERT AS-ODNs total numbers of changed genes of 59 (ASt2206) & 101 (ASt2331); most of them upregulated (ASt2206: 66%, ASt2331: 90%; Fig.3a) • 15 of 59 genes (25%) changed by ASt2206 were also affected by AS-SVV, whereas 25 genes (42%) affected simultaneously by AS-VEGF; concordance between ASt2331 & AS-VEGF higher (75/101, 75%) than that between ASt2331 & AS-SVV (36/101, 36%) • list of genes changed by both of the hTERT AS-ODNs (ASt2206, ASt2331) Table II • comparison of this hTERT AS-ODN gene list with genes, whose expression was altered by AS-SVV & AS-VEGF high degree of concordance: from the 28 genes, 22 genes (79%) were also up-regulated by AS-VEGF, 13 genes (46%) were co-affected by AS-SVV & 11 genes (39%) were altered together by all AS-ODNs (Table II) • 4 genes differentially expressed exclusively after treatment with hTERT AS-ODNs • a variety of genes known to be involved in stress response were induced by treatment with AS-ODNs against different targets (e.g. ATF3, CEBPB, Table II); assumption: these effects may be independent of effects on the AS-ODN targets • Effects of various AS-ODNs on cell growth • - both hTERT AS-ODNs reduced numbers of EJ28 cells within 24 h after transfection (Fig.4) • Influence of scrambled hTERT AS-ODNs on cellular viability & target expression • scrambled SCR-ODNs SCR2-5 derived from ASt2331 (Table I): scrambled SCR2 construct had neither an influence on cellular viability nor on hTERT expression (Fig.5); SCR3 reduced the viability & the hTERT expression of EJ28 cells more efficiently than the primary ASt2331; SCR4 or SCR5 had no or little effect on viability, whereby SCR5 caused a moderate hTERT repression beside the effects on target expression also target-independent effects of hTERT AS-ODNs contributed to the growth inhibition • Effects of hTERT siRNAs on target expression of BCa cells • reduction of the hTERT transcript numbers by si-hTERT1 & si-hTERT2 at 24 h after transfection (Fig.2) • Expression profiling by microarrays after treatment with hTERT siRNAs • total number of altered genes clearly differed between si-hTERT1 (41 genes) & si-hTERT2 (118 genes) (Fig.3b), proportions of upregulated genes were 37% (si-hTERT1) & 44% (si-hTERT2) • 7 (17%) concordant genes were identified by comparing si-hTERT1 with si-SVV as well as by comparing si-hTERT1 with si-VEGF; of these, 3 genes (EREG, IL13RA2, RIG) were found in both of the comparisons, 10/118 (8%) & 7/118 (6%) genes were regulated in parallel by si-hTERT2/si-VEGF & si-hTERT2/si-SVV, F-box & FBXL11 & G3BP2 were altered by all siRNAs (Table III) • 11 genes were regulated together by si-hTERT1 & si-hTERT2, whereof 7genes (64%, all ) were exclusively altered by the hTERT si-RNAs & not by si-SVV or si-VEGF (Table III) • hTERT siRNA gene list included 2 oncogenes: EGFR & FOSL1 decrease of expression • also the LAMC2 gene (involved in cell adhesion& migration) decrease of expression • Validation of the microarray data by qPCR & Western blotting • - for verification qPCRs for 7 genes with different changes on microarrays FCs of qPCRs correlated well with those from microarrays (qPCRs more sensitive; Table IV); transfection with both si-hTERT1/2 diminished EGFR protein after 24 h, si-VEGF (Fig.6) & si-SVV (not shown) had no effect on EGFR protein content • Effects of hTERT siRNAs in combination with CT on growth of EJ28 cells • no significant effects on viability, proliferation or apoptosis by si-hTERT1 or si-hTERT2 (24 h), but decreased number of cells in S-phase 48 h after si-hTERT2 transfection (21% vs. 31% in the control) & increase of cells in G1 (70% vs. 59%, data not shown) • an hTERT inhibition by si-hTERT2 followed by incubation with a relatively low concentration of MMC caused a decrease in the cell count of EJ28 cells (compared to si-hTERT2 or MMC treatment (Fig.7a), reduction by si-hTERT2+MMC to 50% of the control (NS-si + MMC) after 72 h • rate of apoptosis was specifically increased after treatment with si-hTERT2+MMC (33.7%) compared to NS‑si+MMC (17.3%) (Fig.7b) Table I Sequences of nucleic acid constructs. All ODNs contained two phosphorothioates on the terminal nucleotides of the 5’-site and the 3’-site. The mRNA target sequences (5’-3’) were shown for the siRNAs. Scrambled nucleotides of the SCR-ODNs in comparison to ASt2331are depicted underlined. References: 1) Kraemer, 2003 [5]; 2) Fuessel, 2004 [13]; 3) Ning, 2004 [14]; 4) Forster, 2004 [15]; 5) Chen, 2000 [16] a b Fig.1 Schematic description of the comparative analysis of expression signatures by oligonucleotide microarrays. The cells were treated with AS-ODNs targeted at hTERT (ASt2206, ASt2331) and control AS-ODNs (AS-SVV, AS-VEGF) as well as with hTERT- siRNAs (si-hTERT1, si-hTERT2) and control siRNAs (si-SVV, si-VEGF). Each AS-ODN and siRNA group was normalized to cells treated by NS-ODN or NS-si, respectively. Fig.3 Venn diagrams illustrating the numbers of differentially expressed genes and their overlaps. (a) 12 h after treatment with hTERT AS-ODNs. (b) 24 h after treatment with hTERT siRNAs. Each circle described the effects of a construct targeted at hTERT (solid line) or of a control construct (dashed line) directed at survivin (AS-SVV, si-SVV) or at the vascular endothelial growth factor (AS-VEGF, si-VEGF), each normalized to the NS-ODN or NS-si, respectively. Percentages of up-regulated genes are shown in brackets. Fig.2 Target-specific action of AS-ODNs and siRNAs. The relative hTERT expression (hTERT/PBGD) was measured by qPCR at 12h (AS-ODNs) & 24h (siRNAs), respectively, and normalized to those of NS-ODN and NS-si treated samples, respectively. Fig.7 Chemosensitization of EJ28 cells by hTERT siRNA pretreatment. (a) reduction of cell count and (b) increased apoptosis after pretreatment with 200 nM si-hTERT2 followed by incubation with 0.5 µg/ml MMC or 2.0 µg/ml CDDP. Apoptosis was quantified as proportion of annexin V-posive cells, measured by flow cytometry. Fig.4 Effects of transfection with hTERT-AS-ODNs on EJ28 cell count. 1 2 3 4 EGFR -Actin • Materials & Methods • Cell culture and transfection • the human BCa cell line EJ28 was transiently transfected with ODNs (Invitrogen) and siRNAs (Qiagen) (Table I) at 250 nM complexed with Lipofectin (LF) (Invitrogen) at a LF:ODN-ratio of 3:1 (w/w) or with DOTAP (Roche) at a DOTAP:siRNA-ratio of 4:1 (w/w) • treatment with scrambled ODN (SCR2-SCR5, Table I) derived from the hTERT AS-ODN ASt2331 • effects on cellular viability measured by the WST-1 assay (Roche) • Combination of hTERT siRNAs and chemotherapeutic agents • - cisplatin (CDDP) and mitomycin C (MMC), diluted in culture medium, treatment scheme & analysis of apoptosis (annexin V assay) as described before [7] • Sample preparation for microarray hybridization • isolation of total RNA using RNeasy Mini Kit (Qiagen), agarose gel electrophoresis • single stranded cDNA (from 8 µg RNA) using a T7-OligodT24-primer (TibMolbiol) & SuperScript II (Invitrogen), secondary strand synthesis of cDNA using E.coli DNA Ligase, E.coli DNA Polymerase I, RNase H & dNTPs (all from Invitrogen) • purification of double stranded cDNA by GFX PCR DNA and Gel Purification Kit (Amersham), copy into biotin-labeled cRNA (Megascript T7 kit, Ambion) • purification of cRNA using RNeasy columns (Qiagen) followed by quantification, fragmentation and hybridization on HG-U133 A arrays (Affymetrix) for 16 h at 45°C • scanning of the chips using a GeneArray scanner (Agilent) • Data analysis and comparison strategies • all probe sets from each array were normalized to a target intensity of 500 • analysis of the output files by dCHIP 1.3 software (www.dchip.org) by PM-only model • 1st step: each AS-ODN array (ASt2206, ASt2331, AS‑SVV, AS‑VEGF) was compared to the NS-ODN array & each siRNA array (si‑hTERT1, si-hTERT2, si-SVV, si-VEGF) to the NS-si array (Fig.1) • specific gene lists for target-specific AS-ODN or siRNAs were compared to those for NS controls fold changes (FC) as cut offs (2.0 for AS-ODN, 1.7 for siRNA) • 2nd step: generation of 2 gene lists containing differentially expressed candidates for hTERT-directed AS-ODNs and siRNAs, respectively • 3rd step: these hTERT gene lists were compared with those obtained by comparison with the SVV arrays & VEGF arrays (normalized to the NS controls) • comparison of hTERT AS-ODN specific & hTERT siRNA specific gene lists (Fig.1) • Quantitative polymerase chain reaction (qPCR) analyses • hTERT mRNA quantification by LightCycler TeloTAGGG hTERT Quantification Kit (Roche) • for RT (1 µg total RNA) Superscript II RT (Invitrogen) & random hexamer primers • cDNA dilution of 1:5 for qPCR assays (TaqMan Gene Expression; Applied Biosystems) at the LightCycler for selected candidate genes (ATF3, EGR1, RHOB, PDCD4, RAB31, ID2) • serially diluted PCR fragments (10E1-10E6) for the generation of calibration curves • PCR assay for the reference gene TBP was adopted from Linja et al. [8], all qPCRs except for hTERT using the LC FastStart Master Hybridization Probe kit (Roche) & represent the mean of independent duplicates • EGFR protein detection by Western blotting • lysis of BCa cells (510E4/sample) in loading buffer, incubation at 95°C for 5 min • WB analyses (7.5% PAA) using a monoclonal anti-EGFR ab (1:1000; Biosource), • -actin detection by a monoclonal anti--actin ab (1:8000; Sigma) as control; secondary anti-mouse-HRP ab (1:1000; Dako) & ECL system (Amersham) Fig.5 Correlation between viability and hTERT expression after treatment with the hTERT targeting ASt2331 and its modified counterparts. The viabilities (WST-1 assay) and the relative hTERT/PBGD expression ratios were normalized to those of the NS-ODN samples. Fig.6 EGFR protein detection. The protein lysates of EJ28 cells were generated 24h after transfection with si-hTERT1 (1), si-hTERT2 (2), si-VEGF (3) and NS-si (4). -actin served as a control for equal loading. Table II hTERT AS-ODN gene list. Shown are genes, regulated together by both of the hTERT AS-ODNs and the influence of AS-SVV and AS-VEGF on these genes. Negative fold changes indicate downregulation. nc – not changed Table III hTERT siRNA gene list. Shown are genes, regulated together by both of the hTERT siRNAs and the influence of si-SVV and si-VEGF on these genes. Negative fold changes indicate downregulation. Table IV Validation of differentially expressed genes identified by microarrays using qPCR. The expression values of ATF3 and EGR1 were normalized to the reference gene PBGD; all other expression values were normalized to TBP. Negative fold changes indicate downregulation. FC – fold change • Conclusions • 2 hTERT-directed AS‑ODNs (ASt2206, ASt2331) changed the expression of different genes mainly involved in stress response but without an association to telomerase function immediate growth inhibition was caused, at least in part, by off-target effects; in comparison, siRNA-mediated blockade of hTERT was accompanied by the down-regulation of the oncogenes FOSL1 & EGFR • 2 microarray-based studies independently found an association of the expression of both EGFR & FOSL1 with metastatic phenotype [9,10]. • comparison of signatures of matched BCa tissue pairs upregulation of FOSL1 in malignant tissues [11]; • upregulated expression of FOSL1 & EGFR correlates with CDDP resistance in ovarian cancer cells [12] • for the first time we show that repression of the hTERT transcript number downregulates EGFR expression both at the mRNA & protein levels potential new function of hTERT in the regulation of EGFR-stimulated proliferation • siRNA-mediated hTERT knock-down caused enhancement of the antiproliferative capacity of MMC & CDDP • - hTERT promotes the growth of tumor cells not only by telomere lengthening but rather via multiple pathways References [1] Nakamura TM et al. Science 1997;277:955-9. [2] Poole JC et al. Gene 2001;269:1-12. [4] Smith LL et al. Nat Cell Biol 2003;5:474-9. [4] Saretzki G et al. Cancer Gene Ther 2001;8:827-34. [5] Kraemer K et al. Clin Cancer Res 2003;9:3794-800. [6] Folini M et al. Eur J Cancer 2005;41:624-34. [7] Kraemer K et al. J Urol 2004;172:2023-8. [8] Linja MJ et al. Cancer Res 2001;61:3550-5. [9] Modlich O et al. Clin Cancer Res 2004;10:3410-21. [10] Song B et al. World J Gastroenterol 2005;11 1463-72. [11] Dyrskjot L et al. Nat Genet 2003;33:90-6. [12] Macleod K et al. Cancer Res 2005;65:6789-800. [13] Fuessel S et al. J Urol 2004 171;2471-6. [14] Ning et al. Int J Oncol 2004 25; 1065-71. [15] Forster et al. Cancer Lett 2004 212;95-103. [16] Chen et al. Neoplasia 2000 2;235-41