Download
1 / 17
170 likes | 372 Views
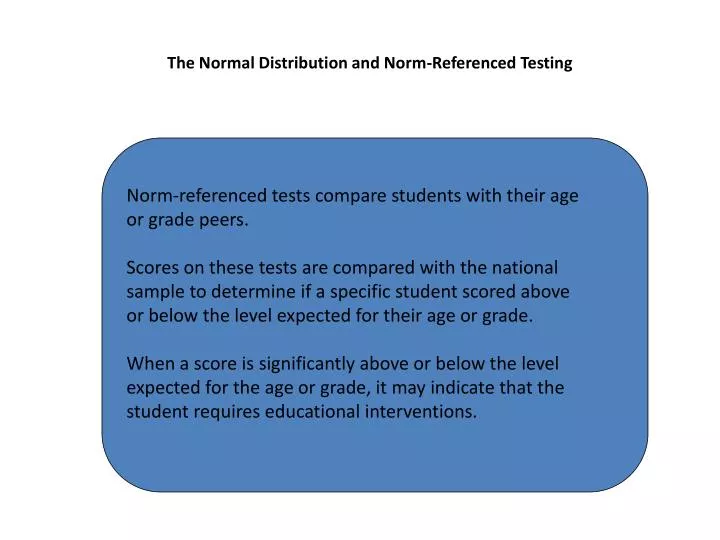
The Normal Distribution and Norm-Referenced Testing. Norm-referenced tests compare students with their age or grade peers. Scores on these tests are compared with the national sample to determine if a specific student scored above or below the level expected for their age or grade.

E N D
The Normal Distribution and Norm-Referenced Testing Norm-referenced tests compare students with their age or grade peers. Scores on these tests are compared with the national sample to determine if a specific student scored above or below the level expected for their age or grade. When a score is significantly above or below the level expected for the age or grade, it may indicate that the student requires educational interventions.
Norm-Referenced Test Scores DERIVED SCORES • Age and grade equivalent are ordinal scores • Percentile rank scores • Standard scores use a set mean and standard deviation • Stanines represent a range of performance
Age and grade equivalents: • Represent the average number of items answered correctly by students in the sample in a particular grade • Do not represent the actual skill level of the item or of the student • Percentile Ranks: • Do not represent a numerical scale with equal intervals • However are easy to interpret and explain • Stanines: • Represent a range of performance • Are not equidistant • Represent large segments of ability and are NOT precise indicators of performance • Standard scores: • Use a set mean and standard deviation • Represent equal units • Communicate a “Range of Performance” (i.e., Average, Above Average etc.)
CAUTIONS about AE & GE • Age and Grade-level Equivalent scores are determined by giving a test that is developed for a particular age/grade to students in other ages/grades. For instance, test designers establish grade-equivalents for a 4th grade test by giving that same test to students who are in the 6th and the 2nd grades. • The scores are often misunderstood; be careful when you interpret them with parents. If a 4th grader received a 7.0 grade equivalent score on a 4th grade reading achievement test, the parents may believe their child is ready for 7th grade material. Actually, the score means that the child reads 4th grade material as well as the average 7th grader.
Percentile Ranks -Scores that express the percentage of students who scored as well as or lower than a given student’s score. A student received a percentile rank of 75 on a recent statewide exam. What does the 75 mean? This indicates that 75% of the students in the same grade or age group made the same score or a lower score. It also means that 25% of this group made the same score or higher than this student. So, you can say that this student scored as well as or better than 75% of his peers.
Standard Scores- • Scores should be reported as confidence intervals • (We’ll get to this soon ) • Scores should be described in relation to a range of • performance in which they fall
Relationship Between Types of Scores with Performance Ranges Average High Average Low Average Above Average Below Average
Confidence Intervals • Generally speaking: Confidence intervals are used to discuss students’ scores because all tests contain error (SEM) so, we can only confidently report students “observed or obtained” scores and their possible range of true scores. • That is, if a student obtained a standard score of 73 on a test, given a SEM of 3 we can estimate with 68% confidence that her true score fell somewhere between 70 and 76. Therefore, she scored in the Low Average range on the test. • See the CI handout for details about how to calculate these intervals.
When Interpreting Assessment results… • Always discuss the key derived scores provided by the assessment tool (often times these include: PR, Scaled Scores, Stanines, and Standard Scores) • Always relate Standard Scores to performance ranges • Follow test guidelines • Some tests have a unique performance scale to add detailed description about results (e.g., KeyMath has a scale of “weak, average, strong”) • Include GE or AE scores if you interpret them accurately and feel confident in explaining them to other teachers and parents. Use these scores to corroborate/contrast instructional level results from CBAs • Always include information about the student’s testing behaviors, error patterns, and notable performance strengths in your discussion of results • When discussing specific standardized test results • Provide a brief summary of the test first • Discuss each subtests’ results • Then discuss each “Cluster” or “Composite” results • Finally discuss “Total Test” results
Sample wording to discuss scores: RAW SCORES: Amanda answered __ out of __questions correct on the Geometry subtest. PERCENTILES She scored at the __th percentile, indicating that she performed as well as or better than ___% of the other __year old (or ___ grade) students who took this test. GRADE LEVEL EQUIVALENT The grade level equivalent score of ____ suggests that she performed as well as the average _____ grader in the ______ month of school on these test items. STANDARD SCORES and CONFIDENCE INTERVALS Amanda’s observed standard score on this subtest was (X). Using a standard error of measurement of (SEM), it is possible to say with 68% confidence that Amanda’s true standard score falls between ___ and ___. RANGE of PERFORMANCE Therefore, Amanda’s performance on this test places her in the _________ range of performance.
It would end up reading as one paragraph like this… Amanda answered 17 out of 30 questions correct on the Geometry subtest. She scored at the 59th percentile, indicating that she performed as well as or better than 59% of the other 12-year-old students who took this test. She earned a grade level equivalent score of 6.3, which suggests that she performed as well as the average 6th grader in the 3rd month of school on those test items. Amanda’s observed standard score on this subtest was 102. Using a standard error of measurement of 5, it is possible to say with 68% confidence that Amanda’s true standard score falls between 63 and 73. Therefore, Amanda’s achievement on this subtest places her in the Average range of performance.
Sample Activity to practice interpreting test results…(using age norms) • Discuss raw score • Discuss the percentile rank. • Discuss GE • Discuss Standard Score • Calculate a 68% confidence interval and discuss it. • Discuss the range of performance. Raw score Percentile Rank GE Standard Score SEM 28 17 3.1 83 2
Sample Activity to practice interpreting test results…(using grade norms) • Discuss raw score • Discuss the percentile rank. • Discuss GE • Discuss Standard Score • Calculate a 68% confidence interval and discuss it. • Discuss the range of performance. Raw score Percentile Rank GE Standard Score SEM 45 87 9.7 117 2
Sample Activity to practice interpreting test results with additional scores & discussion of error patterns…(using grade norms) Raw score Percentile Rank GE Scaled Score Standard Score SEM 9 6 1.7 3 68 3 Item- sluke student response- skul Item- saist student response- sat Item- tayed student response- tad