Download

1 / 121
1.22k likes | 1.52k Views
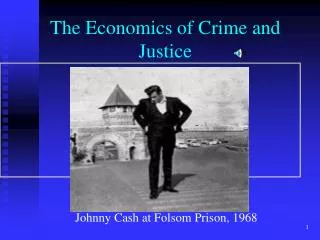
The Economics of Crime and Justice. The News. Gangs Drugs. Tu Feb 7, 07. Outline. UCR Offenses Per Capita by State The Meth Epidemic Crime in California. UCR Offenses Per Capita By State. Crime Generation: OF = f(CR,SV, SE, MC)

E N D
The News • Gangs • Drugs
Outline • UCR Offenses Per Capita by State • The Meth Epidemic • Crime in California
UCR Offenses Per Capita By State • Crime Generation: OF = f(CR,SV, SE, MC) • OFPC = (PRPC, SE,MC), i.e offenses per capita varies with prisoners per capita, causal variables and moral compliance • SE: causal variables • Human capital: % of students above basic grade 4 reading, deaths per 100,000 from heart disease,% of children below poverty • MC moral compliance • % catholic, % weekly church attendance
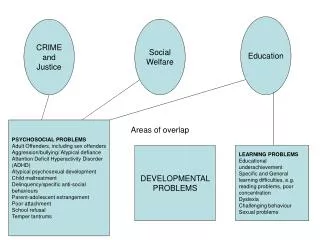
No control Bad Health (low human capital) decreases crime
No Control Education Reduces crime Moral compliance ditto Less Poverty ditto Health insignificant
Income Expenditures Per Capita CCT Education Moral Compliance Less poverty UCR Offenses Per Capita
Front Line: The Meth Epidemic • http://www.pbs.orgAssignment for class • 1.5 million addicts in the US • Worldwide more addicts than for horse and coke, combined • Different than heroin and cocaine • No natural supply • Synthetic • 9 factories in the world manufacture pseudoephedrin • Could focus on Supply • Limit availability of pseudoephedrin • Roadblock: pharmaceutical lobby
50 % of children In Oregon are there Because of meth- Addicted parents
Prison Building since 80’s: Some Ideas • Death Penalty Controversy in the 70’s • Was death penalty effective? • Was death penalty moral? • Ignoring incentives • Expected cost of punishment deters everybody • Detention only controls those you catch • The law of unforeseen consequences • Relying on detention means the gulag • The power of ideas • The “Constancy of Imprisonment” hypothesis • The “Serious Offender”
Four Periods: #1 1930-1983 except WWII, constancy # 2 WWII #3 1984-1998, expansion #4 1999-
Crime in California • Causality and Control • Corrections: Dynamics and Economics • Correctional Bureaucracy
Use the California Experience • Crime rates Have Fallen. Why Haven’t Imprisonment rates? • Apply the conceptual tools developed prior to the midterm • Criminal justice system schematic • crime control technology
Schematic of the Criminal Justice System: Coordinating CJS “The Driving Force” Causes ?!! Weak Link Offense Rate Per Capita Crime Generation Expected Cost of Punishment (detention, deterrence) Expenditures Crime Control
What are the facts? • Expenditures per capita on the CA criminal justice system
What are the facts? • Expenditures per capita on the CA criminal justice system • Expenditures per capita in real $ are rising steadily • The big ticket items are enforcement and corrections • Offenses per capita
Trends In Crime in California level Growth 1952 1980 1992 Source: Crime and Delinquency in California, 2002 http://caag.state.ca.us/ Social Welfare Lecture (#1 LP)
What are the facts? • Offense rates per capita rose rapidly until 1980 • Leveled off in the 1980’s • Declined in the nineties • Are relatively stable in this decade
Can we identify the causes? • The factors that cause crime might have been getting better in the latter 90’s
Schematic of the Criminal Justice System; Death Penalty Causes ? Weak Link Offense Rate Per Capita Crime Generation Expected Cost of Punishment Variable, up & down Steady increase (detention, deterrence) Expenditures Crime Control
Schematic of the Criminal Justice System; Jobs and Crime Causes ?:Economic Conditions Weak Link Offense Rate Per Capita Crime Generation Expected Cost of Punishment (detention, deterrence) Expenditures Crime Control
Note: • The misery index bottoms out in 1998 and the crime rate bottoms out in 1999 • There is visual evidence that there may be a connection
1980 2002 1954 1952 Jobs and Crime Lec #2 LP
What are the facts? • Control variables • Imprisonment as a measure of detention and deterrence
Schematic of the Criminal Justice System: Coordinating CJS “The Driving Force” Causes ?!! Weak Link Offense Rate Per Capita Crime Generation Expected Cost of Punishment (detention, deterrence) Expenditures Crime Control
The number of prisoners per capita is leveling off • Is this why the crime rate is turning up?
Note • When prisoners per capita was flat, offenses per capita was growing • When prisoners per capita started growing, offenses per capita leveled off and then declined
What is Affecting Crime Rates? • Economic Conditions? • Imprisonment Rates? • Both?
Model Schematic Causality: California Misery Index Crime Generation: California Index Offenses Per Capita Crime Control: California Prisoners Per Capita