Download
1 / 15
150 likes | 221 Views
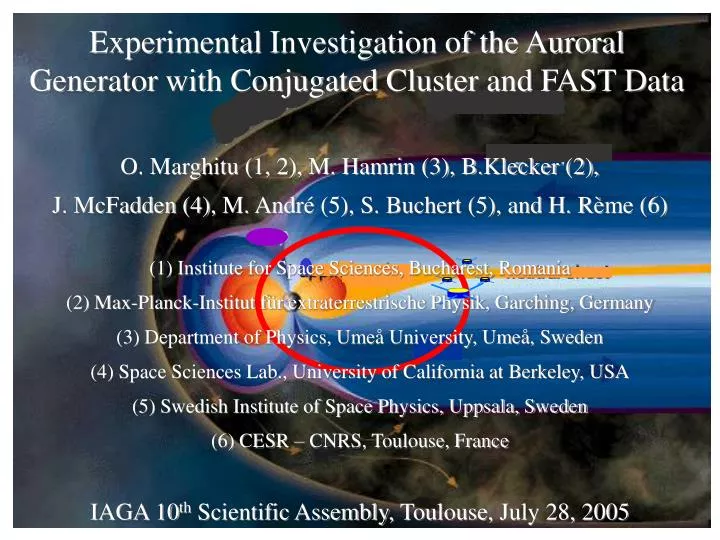
Experimental Investigation of the Auroral Generator with Conjugated Cluster and FAST Data. O. Marghitu (1, 2), M. Hamrin (3), B.Klecker (2), J. McFadden ( 4 ) , M. Andr é (5), S. Buchert (5), and H. R è me (6) (1) Institute for Space Sciences, Bucharest, Romania

E N D
Experimental Investigation of the Auroral Generatorwith Conjugated Cluster and FAST Data O. Marghitu (1, 2), M. Hamrin (3), B.Klecker (2), J. McFadden (4), M. André (5), S. Buchert (5), and H. Rème (6) (1) Institute for Space Sciences, Bucharest, Romania (2) Max-Planck-Institut für extraterrestrische Physik, Garching, Germany (3) Department of Physics, Umeå University, Umeå, Sweden (4) Space Sciences Lab., University of California at Berkeley, USA (5) Swedish Institute of Space Physics, Uppsala, Sweden (6) CESR – CNRS, Toulouse, France IAGA 10th Scientific Assembly, Toulouse, July 28, 2005
Outline • Background • Conjunction geometry • Data overview • Generator signature • Conjunction timing • Generatoringredients • Summary and prospects
A Background A • To our knowledge, the experimental investigations of the generator region are missing, as far as the evaluation of E•Jand Sis concerned: • The one s/c missions before Cluster could not fully resolve J • Both J and (mainly) E are close to the instrumental detection limit • Recent experimental studies on Alfvén waves: • Polar data, near the PSBL – Wygant et al., 2000, 2002; Keiling et al., 2000, 2001. • Polar vs. Geotail data, in the PS – Angelopoulos et al., 2002. • There is a significant number of theoretical studies on the auroral generator region: • Analytical => e.g. Rostoker and Boström, 1976 • Semi-analytical => e.g. Lysak, 1985, Vogt et al., 1999 • Numerical simulations => e.g. Birn et al, 1996, Birn and Hesse, 1996
The generator region (E·J<0) in the magnetosphere powers the loads (E·J>0) in the auroral acceleration region and ionosphere. • Cluster is in the southern plasma sheet, at 18 RE. FAST passes below the auroral acceleration region, at 0.6 RE. A Background A
The energy flux of a moderate aurora, ~10-2 W/m2, maps to ~10-5 W/m2 in the tail (mapping factor ~1000). If the generator region extends 107 – 108 m (1.5 – 15 RE) along the field line, the power density is ~10-13 – 10-12 W/m3. A Background A
A Background – Precautions... A • ... Choice of the reference system. • ... Derivation of the electric field by using EFW, CIS/CODIF and CIS/HIA data. • ... Evaluation of the current density from FGM data, via the Curlometer method.
B Conjunction GeometryB No ground optical data. No optical data from IMAGE or Polar.
1 mW/m2 16 mW/m2 CData OverviewC
DGenerator SignatureD E•J 5 •10 -13 • Left: Average over the available spacecraft. Right: All the available instruments and spacecraft. • Both CODIF and HIA agree on E·J < 0, but not EFW. However, ASPOC is off on SC1 and SC2. • The main contribution to E·J < 0 comes from the Y direction, on SC1 and SC3. This can be understood by checking the conjunction timing.
E Conjunction TimingE • The detection of the generator signature just on SC1 and SC3 suggests that the CGR varies both in space and in time. • We estimate a CGR extension along the field line of up to a few 1000km. • With a wavy PSB, a similar structure might be located at the FAST footprint. • Tail footprint of FAST, at 18 and20 RE; Cluster track, XGSM19RE. • The conjunction is indicated with the horizontal dashed line. • The shaded yellow area shows roughly the CGR projection near Cluster.
CGR F Generator IngredientsF • CGRs (a) when Jy>>0 and Ey<0 (b). • Pkin0 (c) near PSB => Jdiamag=BPkin/B2 JCurlometer • Sometimes no visible Pkin(c), and no current, due to the tetrahedron orientation.
CGR F Generator IngredientsF • Ptotconst. for all SC, also when Pkin varies between SC (d) => Pkin depends on the distance to the PSB. • Complicated 3D structure of the PSB • Alternation of intervals where Pkin is similar / not similar between SC. • Vz < 0, Vy > 0 (g, h) on SC 1 & 3. • Consistent with the timing analysis. • CGR partially coloc. with an Earthward Flow Region (f) => relation to BBFs ?
CGR F Generator IngredientsF • The Poynting theorem: div S = – ∂W/ ∂t – E·J (1) with WWB=B2/20 PB • ∂ / ∂t d / dt in the satellite system, because Vsat << Vplasma. • In panel (c) => regions where dPkin/ dt >0. Since Ptotconst. => – dPB/ dt >0. • Both terms on r.h.s. of (1) positive => elmag. energy carried away from CGR. • A very clean example => presented in the poster C119.
G Summary G • Cluster data provide the first in-situ experimental evidence for the crossing of generator regions in the magnetosphere. • The CGRs are located near the PSB, where there are strong gradients in the plasma pressure. • The associated diamagnetic current, Jy, together with a negative Ey cause the main contribution to E·J. • The identified CGR correlates with auroral electron precipitation observed by FAST. • At times, Cluster data indicate a net electromagnetic energy flux leaving the CGR, which could contribute to power the aurora near the polar cap boundary.
Additional CGR examples => poster C119, Concentrated generator regions in the nightside auroral magnetosphere. • More detailed discussion on the energy conservation. • The 3D structure of the CGRs. • Potential for a statistical investigation of several events in September – October 2001. • The coupling between CGRs and Alfvén waves. • Potential for application to other generator regions (e. g. LLBL). G Prospects G