Download
1 / 25
250 likes | 328 Views
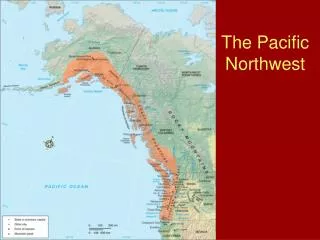
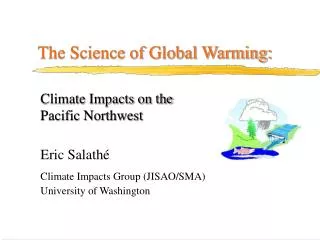
Pacific Northwest Climate Model Scenarios 2008. Climate Impacts Group & Department of Atmospheric Sciences University of Washington. Eric Salathé Philip Mote Valérie Dulière Emily Jump. 19 Models From IPCC Fourth Assessment. Biases (20th c, minus NCEP). 20th century seasonal cycle.

E N D
Pacific NorthwestClimate Model Scenarios 2008 Climate Impacts Group&Department of Atmospheric SciencesUniversity of Washington Eric Salathé Philip Mote Valérie DulièreEmily Jump
Model Performance observed
Emissions scenarios Global IPCC Fourth Assessment
PNW Temperature Change 10°F 0°F
Future Storm Track Changes Change from 1960-2000 to2080-2100 Composite of 16 Global Climate Models Stronger N PacificStorm track North America Asia NP Europe Stronger N AtlanticStorm track ULBRICH ET AL. 2008
Projected Future Changes from Climate Models (2046-2065 versus 1981-2000) SRES A1B SRES B1 IPSL +18.8% +11.8% ECHAM5 +11.4% +10.6% CCSM3 +12.2% +10.8% Percentages of change in the annual maximum daily precipitation with a 10 years return period for each grid cell between 1981-2000 and 2046-2065.
Mesoscale Climate Model • Based on Regional Weather Model (MM5, WRF) • Nested grids 135-45-15 km • Advanced land-surface model (NOAH) • Forced by Global Climate Model output (boundary conditions)
observed sea level rise 1961-2003 1993-2003 1961-2003 1993-2003
Local vertical land motion Pacific Northwest Geodetic Array Verdonck (2006)
Summary • Temp and precip: central values roughly the same as 2005 estimates • 0.5F/decade warming and little change in annual total precip • Increased likelihood of drier summers, wetter winters, heavy rains • Range of projected temp, precip, sea level:no problem to serious consequences