Download
1 / 13
130 likes | 152 Views
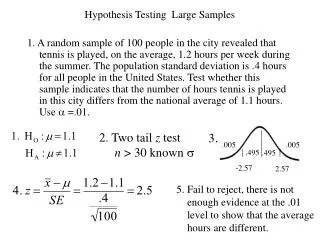
Hypothesis Testing (Testing with Two Samples-I). QSCI 381 – Lecture 30 (Larson and Farber, Sect 8.1). Two Samples Tests - Overview. So far we have compared the results of a sample from a population with a fixed value.

E N D
Hypothesis Testing(Testing with Two Samples-I) QSCI 381 – Lecture 30 (Larson and Farber, Sect 8.1)
Two Samples Tests - Overview • So far we have compared the results of a sample from a population with a fixed value. • We will develop methods to test claims about differences between the values for parameters of two populations, not about the values for the parameters themselves.
Null and Alternative Hypotheses • Let 1 and 2 be the values of a parameter for two populations. The possible null and alternative hypotheses are: These two null hypotheses are different – why?
Conditions for Comparing Two Means • The samples must be taken randomly from each population. • The sample from each population must be independent. • The sample size must be at least 30 (or each population must be normal with a known standard deviation).
Comparing Two Means-I • Given these conditions, the sampling distribution for the difference between the two sample means, i.e. is normal with mean and standard error: • The variance of the sampling distribution is the sum of variances of the individual sampling distributions.
Comparing Two Means-II • A can be used to test the difference between two population means 1 and 2 when a large sample (n 30) is selected randomly from each population and the samples are independent. The test statistic is and the standardized test statistic is: two-sample z-test
Comparing Two Means-III • Notes: • If the sample size is “large”, 1 and 2 can be replaced by s1 and s2. • If the sample size is “not large” this test cannot be used unless the populations are normal and the standard deviations are known.
You are evaluating two labs that process biological samples. The following data have been collected from the two labs. Test the hypothesis (=0.05) that the two labs differ in the time to process a sample. Example-I
Example-I • H0: 1= 2; Ha: 1 2. • =0.05 • This is a two-sided test at the 5% level. The rejection region is |z|>1.96. • The standardized test statistic is: • We reject the null hypothesis at the 5% level.
Two classes of students use different study materials. A control group uses a standard approach, and a second group (random allocation of students to groups) uses a new study approach. The following are data collected from the two groups. Test the hypothesis that using the new materials improves the mean score by more than 10 points. Assume =0.05. Example-II
Example-II • H0: 2 - 110; Ha: 2 - 1>10. • =0.05 • This is a right-sided test at the 5% level. The rejection region is z>1.64. • The standardized test statistic is: • We fail to reject the null hypothesis at the 5% level.
Confidence Intervals • A c-confidence interval for 1-2 can be constructed as follows (note that n130 and n230):
Confidence Intervals(Example) • Construct a 95% confidence interval for 1-2 for example 2. Can anyone see a relationship between confidence intervals and hypothesis tests?