Download
1 / 18
180 likes | 264 Views
Substitution Matrices and Alignment Statistics. BMI/CS 776 www.biostat.wisc.edu/~craven/776.html Mark Craven craven@biostat.wisc.edu February 2002. Substitution Matrices. two popular sets of matrices for protein sequences PAM matrices [Dayhoff et al., 1978]

E N D
Substitution Matrices and Alignment Statistics BMI/CS 776 www.biostat.wisc.edu/~craven/776.html Mark Craven craven@biostat.wisc.edu February 2002
Substitution Matrices • two popular sets of matrices for protein sequences • PAM matrices [Dayhoff et al., 1978] • BLOSUM matrices [Henikoff & Henikoff, 1992] • both try to capture the the relative substitutability of amino acid pairs in the context of evolution
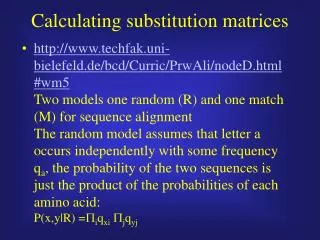
Substitution Matrix Motivation • consider simplest alignment: ungapped global alignment of two sequences, x and y, of length n • in scoring this alignment, we’d like to assess sequences have common ancestor sequences are aligned by chance • we’d like our substitution matrix to score an alignment by estimating this ratio
let be the probability that a and b derived from a common ancestor • then the case where the alignment is due to common ancestry is: Substitution Matrices: Basic Idea • let be the frequency of amino acid a • consider case where alignment of x and y is random:
Substitution Matrices: Basic Idea • the odds ratio of these two alternatives is given by: • taking the log, we get:
Substitution Matrices: Basic Idea • the score for an alignment is thus given by: • the substitution matrix score for the pair a, b is then given by:
PAM Matrices • but how do we get values for (probability that a and b arose from a common ancestor)? • it depends on how long ago sequences diverged • diverged recently: • diverged long ago: • PAM approach: estimate the probability that b was substituted for a in a given measure of evolutionary distance
PAM Matrices • key idea: trusted alignments of closely related sequences provide information about biologically permissible mutations • step 1: for 71 protein families • constructed hypothetical phylogenetic trees • from trees, filled matrix A with number of observed substitutions
PAM Matrices • step 2: from A, calculate matrix containing • step 3: normalize this matrix so the expected number of substitutions is 1% of the protein (PAM-1)
PAM Matrices • there is a whole family of matrices: PAM-10, ..., PAM-250, … • these matrices are extrapolated from PAM-1 matrix (by matrix multiplication) • a PAM is a relative measure of evolutionary distance • 1 PAM = 1 accepted mutation per 100 amino acids • 250 PAM = 2.5 accepted mutations per amino acid
PAM Matrices • step 4: determine the substitution matrix
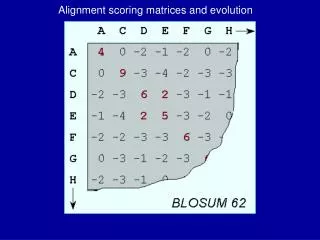
BLOSUM Matrices • similar idea to PAM matrices • probabilities estimated from more distantly related proteins • “blocks” of sequence fragments that represent structurally conserved regions • transition frequencies observed directly by identifying blocks that are at least • 45% identical (BLOSUM-45) • 50% identical (BLOSUM-50) • 62% identical (BLOSUM-62) • etc.
DNA vs. Protein Comparison • If the sequence of interest encodes protein, compare at the protein sequence level: • many changes in DNA sequences do not change the encoded protein • substitution matrices for protein sequences represent biochemical information
Statistics of Alignment Scores(how to choose a threshold for S) • for a given S, we can calculate the probability we would get a match with score > S under a random model (where we’re aligning of a large number of unrelated sequences) • now turn this around: set S so that this probability is small; thus the matches we get are likely to be significant
Distribution of Scores • Karlin & Altschul, PNAS, 1990 • consider a random model in which • we’re looking for HSPs (high scoring ungapped local alignments) • the lengths of the sequences in each pair are m and n • the probability that there is a HSP with score greater than S is given by: • this comes from an extreme value distribution
Distribution of Scores • S is a given score threshold • m and n are the lengths of the sequences under consideration • K and are constants that can be calculated from • the substitution matrix • the frequencies of the individual amino acids
Statistics of Alignment Scores • given this, set S so that probability of getting a score > S by chance is very small (0.05 or less) • this analysis assumes • ungapped alignments • all residues drawn independently • expected score for a pair of randomly chosen residues is negative: • computational experiments suggest analysis holds for gapped alignments (but K and must be estimated from data)