Download

1 / 23
250 likes | 279 Views
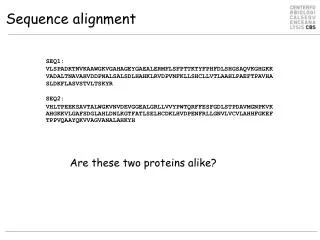
Scoring Matrices for Sequence Alignment. Anne Haake Rhys Price Jones. Scoring Matrices. Sequence comparisons require some scoring matrices To use the alignment algorithms to do database searches, we need some scoring schemes that are based on biological knowledge.

E N D
Scoring Matricesfor Sequence Alignment Anne Haake Rhys Price Jones
Scoring Matrices • Sequence comparisons require some scoring matrices • To use the alignment algorithms to do database searches, we need some scoring schemes that are based on biological knowledge. • Scoring matrices represent evolutionary theory • The choice of matrix can influence the outcome of the analysis • Understanding the theory can help in making an appropriate choice
Nucleotide Scoring • Identity matrix (similarity) A T C G A 1 0 0 0 T 0 1 0 0 C 0 0 1 0 G 0 0 0 1
Nucleotide Scoring 2. BLAST matrix A T C G A 5 -4 -4 -4 T -4 5 -4 -4 C -4 -4 5 -4 G -4 -4 -4 5
Nucleotide Scoring 3. Transition/Transversion Matrix A T C G A 0 5 5 1 T 5 0 1 5 C 5 1 0 5 G 1 5 5 0
Protein Scoring 1. Identity Matrix • Score 1 if equal • Score 0 if not equal • Easy, but weak 2. Genetic code Matrix • Determine the minimum number of base changes required to convert one amino acid into another • Edit distance: will be 0, 1, 2, or 3 • Is a distance matrix Matrix • Not very discriminating; consider CAU Code Table
Protein Scoring 3. Hydrophobicity Matrix • Based on physical/chemical properties of the amino acids Hydrophobicity matrix 4. Log odds Matrices • Which amino acids are most likely to be seen? - In close relatives? In distant relatives? Ex. PAM and BLOSUM matrices
PAM and BLOSUM Substitution Matrices for Amino Acids • Based on actual substitution rates among the various amino acids in nature • Empirically derived; huge amount of work! • General Strategy: • Select a collection of related proteins and align them • Observe the frequencies with which one amino acid is replaced by another = A • Figure out how often, given the frequencies of the amino acids in your set, the replacement would occur by chance alone = B • The ratio A/B (odds) tells us how often the replacement has occurred in evolution (as compared to a random process)
PAM and BLOSUM Substitution Matrices for Amino Acids • Matrices are 20 X 20 tables of values that describe the probability of a residue pair occurring in an alignment • The scoring matrix values are logarithms of ratios of the probability of a meaningful occurrence to the probability of random occurrence.
PAM Matrices • PAM stands for Point Accepted Mutation or Percent Accepted Mutation • Developed by Dayhoff et al. 1978. • Model based on empirically derived data • Groups of closely related proteins were aligned (global alignments) • So that probability of more than one replacement at a single site was negligible • 1,572 changes in 71 groups of closely related proteins 1 PAM
PAM Unit • Matrix represents substitution probabilities over a fixed unit of evolutionary change • e.g. PAM1 is 1 substitution per 100 residues or one PAM unit (an amount of evolution) • 1% divergence • Start with a given polypeptide sequence M at time t, and observe the evolutionary changes in the sequence until 1% of all a.a. residues have undergone changes at time t+n. New sequence M’ • What is the probability that a.a. i in M will be replaced by a.a. j in M’? • To get your answer, look it up in the PAM-1 table (entry Rij)
PAM Matrix • Matrix values are based on the model that one sequence is derived from the other by a series of independent mutations, each changing one amino acid in the first sequence to another amino acid in the second • The model is an approximation • Many assumptions • Not all of the assumptions necessarily hold
PAM Matrix • PAM-1 is used to derive other PAM matrices • Why? • PAM-1 is 1 % accepted mutations • PAM-N is N% accepted mutations • To derive PAM-N, the PAM-1 matrix is multiplied by itself N times • e.g. PAM-100; PAM-250 • What does this mean for errors?
Which PAM matrix do I use? • Depends on how closely the sequences are believed to be related • PAM-1 use for more closely related sequences • PAM-1000 more distant relationships • In practice, PAM-250 often used in alignment and database searching software.
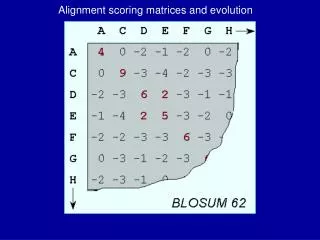
BLOSUM Matrix • BLOSUM is from BLOcks SUbstitution Matrix • originate with a paper by Henikoff and Henikoff (1992; PNAS 89:10915-10919)
BLOSUM Matrix • derived from the BLOCKS database BLOCKS database • derived by observing substitution rates among similar protein sequences • Use families of related (distantly) protein sequence because need to do a multiple alignment • Are interested in substitutions rather than indels which tend to occur more in distantly related sequences • ungapped multiple alignments are used to identify conserved blocks of amino acids
BLOSUM matrix • Clustering approach used to sort the sequences into closely related groups where the sequences are similar at some threshold value of percentage identity • e.g. BLOSUM62 is standard matrix for ungapped alignment.. 62 represents the cutoff value for clustering (sequences put into same cluster if more than 62% identical). • Substitution frequencies for all pairs of amino acids are then calculated between the groups and this used to calculate a log odds BLOSUM matrix
BLOSUM • BLOSUM-62 matrix: appropriate for comparing sequences of approximately 62% sequence similarity • BLOSUM-80 matrix: 80% similarity
PAM vs BLOSUM • Lower PAM numbers used for more closely related sequences • Lower BLOSUM numbers used for more distantly related sequences • Dayhoff-like matrices (PAM) derive their initial substitution frequencies from global alignments of very similar sequences. • The BLOSUM matrix is derived from local multiple alignments of more distantly related sequences
Constructing a BLOSUM matrix • In class • In lab
Constructing PAM Matrices • A multiple alignment is constructed between sequences with high identity (>85%) • A phylogenetic tree is constructed from the aligned sequences • Substitutions are identified between each pair of sequences in the tree • The substitution matrix is constructed by calculating the frequency of substitution for each amino acid, the relative mutability for each, and the mutation probability for each pair of amino acids (see example)
Constructing PAM Matrix • Example