Download
1 / 37
370 likes | 379 Views
Thorium Based Thin Films as EUV Reflectors. Jed Johnson Honors Defense. Reflectors in EUV range. EUV range is about 100-1000Å General Challenges: - hydrocarbon buildup - absorption - high vacuum needed Complex index of refraction: ñ=n+ik. Applications of EUV Radiation.

E N D
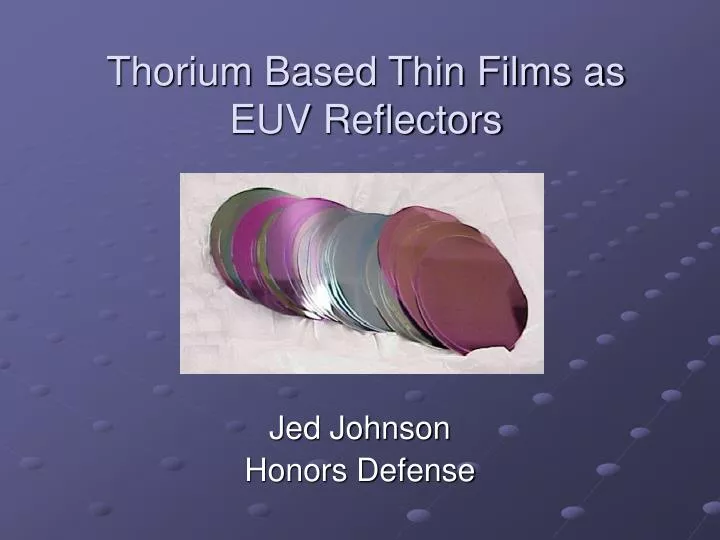
Thorium Based Thin Films as EUV Reflectors Jed Johnson Honors Defense
Reflectors in EUV range • EUV range is about 100-1000Å • General Challenges: - hydrocarbon buildup - absorption - high vacuum needed • Complex index of refraction: ñ=n+ik
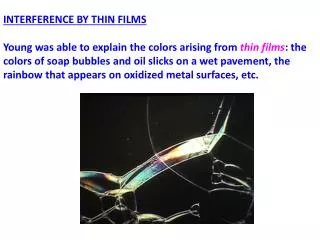
Applications of EUV Radiation Thin Film or Multilayer Mirrors EUV Lithography Soft X-ray Microscopes EUV Astronomy The Earth’s magnetosphere in the EUV Images from www.schott.com/magazine/english/info99/ and www.lbl.gov/Science-Articles/Archive/xray-inside-cells.html.
Creating Thin Films • Ions from an induced argon plasma bombard a target. Atoms are then ejected from the target and accumulate as a coating on the substrate.
Measuring Reflectance • Data is taken primarily at the ALS (Advanced Light Source) at LBNL in Berkeley, CA. Accelerating electrons produce high intensity synchrotron radiation.
Why Actinides? Beta vs. delta scatter plot at 4.48 nm Note: Nickel and its neighboring 3d elements are the nearest to uranium in this area.
δ vs. (δ + β) • 30.4 nm (41 eV)
Thorium vs. Uranium • Why such a large difference in optical properties? • Thorium (11.7 g/cm^3) is less dense than uranium (19.1 g/cm^3).
However…. • The mirror’s surface will be oxidized. • At optical wavelengths, this oxidation is negligible. It is a major issue for our thin films though.
Problems with Uranium • Immediate oxidation to UO2. (10 nm in 5 min) • Further oxidation to U2O5 is less rapid. (5 – 10 nm in six to 12 months) • Can even proceed to UO3! • Lower density = lower reflectance
A Possible Alternative: Thorium • Only one oxidation state: ThO2. We know what we have! • The densities of UO2 (about 11 g/cm3) and ThO2 (9.85 g/cm3) are similar. • Rock stable: Highest melting point (3300 deg C) of any known oxide.
Th vs. EUV Other Reflectors • Between 6.5 and 9.4 nm, Th is the best reflector we have measured.
Einstein’s Atomic Scattering Factor Model • Photons are scattered principally off electrons. More electrons = higher reflection. • Assumption: condensed matter may be modeled as a collection of non-interacting atoms. In the higher energy EUV, chemical bonds shouldn’t contribute. (except near threshold regions)
Can the ASF model be applied in the visible light range? • Silicon (opaque) and oxygen (colorless gas) combine to form SiO2 (quartz). Clearly the chemical bonds have a dramatic effect on the compound’s properties.
Where then is the ASF model valid? • At some point, ASF model and measured data should converge. • Unpublished BYU study: SiO2 plots never converged up to 300 eV.
Possibility #1 • Bad experiment! Data has never been so clean though and the features are clear. Curve was reproduced March 2004. • Beamline 6.3.2 coordinator at ALS has no explanation.
Possibility #2 • The sputtered film wasn’t pure thorium. • Possibly an alloy? • EDX w/ SEM indicates
Cutting fluid residue left on target? Thorium carbide? Hydrocarbon contaminant? Carbon Impurities in silicon? (EDX “sees through”) Surface XPS only sees Th. Bottom Line: none of these small contributions could have caused a drop from ~70% to ~10% reflectance. Carbon and Oxygen
Possibility #3 • Maybe chemistry IS playing a larger role in this region than previously expected. • Could the atomic scattering model need modification in this range?
Transmission Measurements • Below 14 nm, there is a feature common to reflection and transmission measurements.
Optical Constant Fitting • Th003 is the only transmission sample to be made and analyzed to date. • Least squares procedure fits for optical constants and film thickness.
Characterization Issues • Film thickness (more XRD and ellipsometry) • Film composition (XPS) • Roughness (AFM)
Optical Constant Data 17.0 nm 13.9 nm • Comparison: Calculated beta from transmission. 17.0 nm: 0.0330 13.9 nm: 0.1078 thickness: 197 Ǻ (XRD) Good Agreement!
Conclusions • Th exhibits the highest reflectance of any measured compound from 6.5 to 9.4 Ǻ. • The Atomic Scattering Factor model may need revision in the EUV. • Constants obtained from the fitting program are reasonable.
Future Research • Film oxidation (rate) • Film composition (modeling grain boundaries, interfaces) • ThO2 constant determination • Roughness effects on reflectance / modeling • Theoretical ASF research
Acknowledgments • BYU XUV Research Group colleagues • Dr. David D. Allred • Dr. R. Steven Turley • BYU Physics Department Research Funding
X-Ray Absorption Near Edge Structure (XANES) • Induced current is measured in wire connected to sample as EUV photons strike it. • Absorption information. • Theoretical multiple scattering calculations are compared with experimental XANES spectra in order to determine the geometrical arrangement of the atoms surrounding the absorbing atom.