Download
1 / 40
400 likes | 518 Views
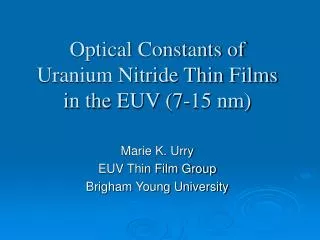
Optical Constants of Uranium Nitride Thin Films in the EUV (80-182 eV). Marie K. Urry EUV Thin Film Group Brigham Young University. Acknowledgements Thanks to:. Dr. David D. Allred Dr. R. Steven Turley Kristi R. Adamson Luke J. Bissell Jennie Guzman Elke Jackson Winston Larsen

E N D
Optical Constants ofUranium Nitride Thin Filmsin the EUV (80-182 eV) Marie K. Urry EUV Thin Film Group Brigham Young University
AcknowledgementsThanks to: Dr. David D. Allred Dr. R. Steven Turley Kristi R. Adamson Luke J. Bissell Jennie Guzman Elke Jackson Winston Larsen Mindy Tonks Department Funding
Outline • Why We Do What We Do • Making Thin Films • Studying Thin Films • Finding Optical Constants • Reflectometer
Why Extreme Ultraviolet (EUV)? Astronomy Our IMAGE Satellite Mirror Project Lithography Projection Imagining Scheduled for 2009 Medicine High Resolution Imaging Microscopes Images courtesy of http://euv.lpl.arizona.edu/euv/, www.schott.com/magazine/english/info99/ and www.schott.com/magazine/english/info99/.
Optical Constants • Index of refraction: N = n + i k • In EUV, n ≈ 1 and k is huge. n = 1 - k = • High and low for maximum reflection for multilayers. →
Why Uranium Nitride? • Uranium • High theoretical reflectivity due to high • Problem: Oxidation • Nitride • Little effect on reflectivity • Prevents oxidation
Reflectance computed using the CXRO Website: http://www-cxro.lbl.gov/optical_constants/mirror2.html
Reflectance computed using the CXRO Website: http://www-cxro.lbl.gov/optical_constants/mirror2.html
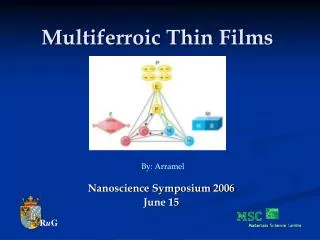
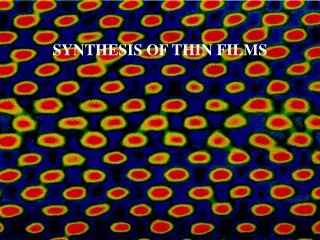
Making Thin Films • Sputtering • Bombard target, uranium, with argon ions • Uranium atoms leave target due to collisions • Nitrogen partial pressure in plasma introduces N atoms • U and UN molecules deposit on our samples
Making Thin Films • 10-30 nm thick • Deposited on: • silicon wafers • quartz slides • polyimide films • SiN membranes • carbon coated TEM grids • Low pressure sputtering • smooth, dense, low stress films
Side Note for Clarification • Samples 002 – 005 • 002 and 003 are U2N3 • 004 and 005 are UN • 005 is new and unmeasured
Making Thin Films • Partial pressure determines stoichiometry • Our system couldn’t control partial pressures in the critical range N2 Partial Pressure vs N/U Ratio Image courtesy of L. Black, et al., Journal of Alloys and Compounds, 315 (2001) 36-41.
Learning About the Samples • Composition • Depends on partial pressure in system • Thickness • Crystal monitor is to the side of the film and gets less accurate with time • Roughness • Optical Constants
X-Ray Photoelectron Spectroscopy (XPS) • Uses photoelectric effect to find composition Images courtesy of http://volta.byu.edu/adamson03.pdf.
X-Ray Photoelectron Spectroscopy (XPS) Counts Survey Scan of Surface Identifying Peaks: 100eV – U 5d5/2 280eV – C1s 380eV – U4f7/2 390eV – U4f5/2 398eV – N1s 530eV – O1s 740eV – U4d5/2 780eV – U4d3/2 980eV – Auger O Energy (eV)
X-Ray Photoelectron Spectroscopy (XPS) Uranium Energy Peaks Counts Energy (eV)
X-Ray Photoelectron Spectroscopy (XPS) Nitrogen Energy Peaks Counts Energy (eV)
X-Ray Diffraction (XRD) • To find thickness • m λ= 2d sin θ
XRD Data Change in theta between 8 peaks minima around theta=1.5 for UO2
Atomic Force Microscopy (AFM) • To Measure Roughness • Result: RMS roughness Images courtesy of http://www.weizmann.ac.il/surflab/peter/afmworks/.
Length Scale vs. RMS Y= -0.5666 x +1.677
Ellipsometry • Optical constants are different for different polarizations of light • If we know the substance and a model for the optical constants, we can find thickness and optical constants in UV Images courtesy of http://www.swt.edu/~wg06/manuals/Gaertner117/ellipsometerHome.htm.
Finding Optical Constants • Advanced Light Source at Berkeley • Light created by synchrotron • Measures reflectance at different angles and wavelengths Image courtesy of http://www.lbl.gov/.
Reflectometer • Reassembled and aligned
Hollow Cathode Light Source • Plasma with H or He • 700 V DC • Spectral Lines from He • 304 Angstroms • 2p->1s • 584 Angstroms • 1s2p->1s2 • Found leaks • Replace plexi-glass
Reflectometer • Replaced CEM • Purchased stages and stepper motors Electron Multiplier Tube
Lab VIEW Program for Centering Detector Assumed a Gaussian Theta/2*theta misalignment Reflectometer
Reflectometer • Other Improvements • Circuit diagrams • SOP’s • Still working • Fixing virus problems
Background (9 minutes) Why EUV? Optical Constants Why Uranium? Making & Studying Thin Films (13 minutes) Sputtering XPS XRD AFM TEM Ellipsometry Finding Optical Constants (10 minutes) What we want to know ALS Reflectometer/ Monochromator Results/Continuing Research (8 minutes) Acknowledgements (1 minute) Outline
To Do • Learn about light source (internet) • Ellipsometry stuff (Dr. Allred) • Update “Problem!!” and data slides (Dr. Allred)
IMD • Written by David Wendt • Computes reflectivities of materials based on their optical constants • We used UO model because of similar densities • (Insert graph here)
Problem!! • Our samples change with time. • The peaks seen in XRD move. • Continuing research in this area.