Download
1 / 32
320 likes | 331 Views
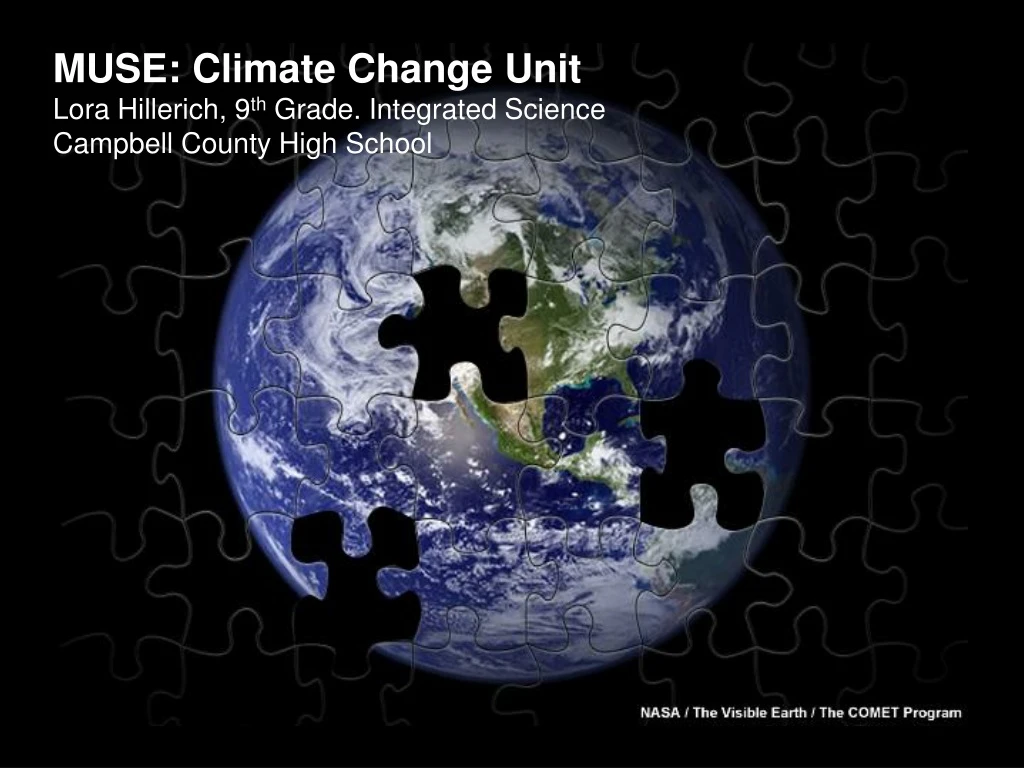
MUSE: Climate Change Unit Lora Hillerich, 9 th Grade. Integrated Science Campbell County High School. DRIVING QUESTION How can I use models, data, and infographics to explain that climate change is real and affected by human activity?. Fitting the pieces together. What changes climate?

E N D
MUSE: Climate Change Unit Lora Hillerich, 9th Grade. Integrated Science Campbell County High School
DRIVING QUESTION How can I use models, data, and infographics to explain that climate change is real and affected by human activity? Fitting the pieces together
What changes climate? • Is it from natural or human causes? • Is it real? • How do we know? • Why should we care? • How sure are scientists? • What next—what can we do?
Climate Change Infographic Project: Finding the PUZZLE PIECES TASK: Create an INFOGRAPHIC using pics, models, data, graphs and text to explain one of the signs/symptoms of climate change, showing that it is real and affected by human activity..
Climate Change Infographic Project: Finding the PUZZLE PIECES Objectives: • Research science information • Critically evaluate the credibility of sources and make sense of ideas from multiple sources • Use and understand graphics representing current data • Use digital technology to effective communicate scientific information in a simple, visual format Audience: Classmates, general public
How do we decide if a source is credible? Activities: • Pre-Assessment/Survey 2. Class Discussion : Perceptions/Opinions • Media Construction of Global Warming: Framing the Debate Video Clip Decoding -Glenn Beck, Climate of Fear -Leonardo diCaprio, 11th Hour Resources: www.facingthefuture.org(Climate Change Curriculum 9-12) www.projectlooksharp.org (Media Construction of Global Warming Curriculum)
What is Climate Change? Activities: • Student Reading: What Is Climate and How is It Changing? 2. Lecture/Guided Notes: -Greenhouse Effect -Earth system/natural processes -Human Activity/Greenhouse gas emissions Resources: www.facingthefuture.org(Climate Change Curriculum 9-12) www.meted.ucar.edu (COMET Program-University Corporation for Atmospheric Research)
What are the claims/evidence? Activities: 1. Watch Documentary Film: Chasing Ice (Extreme Ice Survey Project) 2. TASK: Research to find the “puzzle pieces” we need to complete our project. TOPIC--Search forSigns and Symptoms of climate change. WhatEVIDENCE-data/observations-are scientists collecting?
What constitutes a valid and reliable claim? Activities: Lecture/Guided Notes: -Validity and Reliability -What is the “bottom line” about a claim? To what degree is it true or false? -How do we evaluate the evidence? Resources: http://learning.blogs.nytimes.com (The Learning Network-NY Times “Is that a Fact?”) http://www.cerias.purdue.edu/education/k-12/teaching_resources/lessons_presentations/SITECREDIBILITY2.pdf
How are models/data used as evidence for climate change? Activities: 1. LAB: Graphing CO2 Emissions Trends 2. LAB: Growth Rings as Indicators of Climate Resources: NOAA Mauna Loa Data- Months Glencoe Science-Science inquiry Lab Manual
What is an infographic and how are they used to communicate scientific information and evidence? Activities: 1. Lecture/Discussion: “Infographics—The Good, the Bad, and the Ugly” 2. Students brainstorm and generate criteria for good infographic. Resources: The Science Teacher March 2014 : -Using Infographics in the Science Classroom -Science News Infographics Examples: Pinterest-Climate Change Infographics Board
Climate Change Infographic Project: Finding the PUZZLE PIECES TASK: Create an INFOGRAPHIC using pics, models, data, graphs and text to explain one of the signs/symptoms of climate change, showing that it is real and affected by human activity..
The increasing temperatures mean that large areas of the ocean that were once frozen throughout the year now become open water. Polar bears are depended on sea ice for their survival but sea ice is decreasing due to climate change. Climate change effects on ocean animals Rising temperatures, rising sea levels and other trends are having an effect on the world’s sea turtles… In 2008, the U.S. Fish and Wildlife Service listed the polar bear as a threatened species under the Endangered Species Act polar bears are “likely to become endangered in the future.” Today there are fewer than 500 right whales left in the world. These animals have been protected since 1935 and listed as endangered since the early 1970s. Because there is less ice the polar bears have to swim to get there food leaving less energy for reproduction Polar bears are affected by reduced sea ice and loss of its primary food seals
Brittany Bezold Sea ice is decreasing throughout their range due to climate change http://www.bing.com/images/search?q=ice+melting& &selectedIndex=3 As sea ice is thinning and ice is disappearing, the female polar bears are using more energy trying to find land to make a den https://www.google.com/search?q=polar+bear+dens Polar bears depend on ice for their survival. http://www.neaq.org/conservation_and_research/cli mate_change/effects_on_ocean_animals.php · As you can see by the graph the arctic sea ice extent is decreasing and the polar bears are losing their home. http://www.vitalground.org https://www.google.com http://www.ibt imes.com Polar bears could be called “ice bears” because they spend most of their lives wandering on Arctic sea Fish and Wildlife Service Scientists are noticing that less sea ice ice in search of seals. Polar and estimates that the polar bear is freezing because our climate is grizzly bears intersect more often as population is currently at 20,000 warming. Not only is there less ice, the climate warms. to 25,000 bears, up fr om as low the ice is forming later in the fall and as 5,000 - 10,000 bears in the winter. 1950s and 1960s.
Scientists have determined that loading the atmosphere with increasing carbon dioxide and other heat-trapping emissions is raising global temperatures and triggering heavier precipitation events. (http://www.ucsusa.org/news/press_release/climate-change-heavy-rain-flooding-0540.html) http://www.central-vt.com/climate/climate.htm http://www.central-vt.com/climate/climate.htm Worldwide, water vapor over oceans has increased by about 4 percent since 1970 according to the 2007 U.N. Intergovernmental Panel on Climate Change report, its most recent. g global temperatures and triggering heavier precipitation events. From 1958 to 2007, the amount of rainfall in the heaviest 1 percent of storms increased 31 percent, on average, in the Midwest and 20 percent in the Southeast The graphs show that the average snowfall and rainfall amounts are rising. http://blog.mlive.com/grpress_extra/2008/12/photo_gallery_rain_snow_melt_c.html http://blog.mlive.com/grpress_extra/2008/12/photo_gallery_rain_snow_melt_c.html Rain and snow patterns Chaylen Lambert and Cory Pauly
How are Stronger Weather Patterns evidence for climate change? http://www.bing.com/images/search?q=tornado&qpvt=tornado&FORM=IGRE&adlt=strict#view=detail&id=20CDB86B678A071168BD1ACA6FEF888AFF5C98A4&selectedIndex=112 Because of higher temperaturesand increased evaporation, climate change causes other types of storms to get stronger and more powerful. (http://www.epa.gov/climatestudents/impacts/signs/weather.html) Over the past 20 years, hurricanes and other tropical storms in the Atlantic Ocean have became more brutal. (http://www.epa.gov/climatestudents/impacts/signs/weather.html) Hurricanes and other storms can cause major problems for the people and the environment of a region. (http://www.epa.gov/climatestudents/impacts/signs/weather.html) As the top layer of the ocean gets warmer, hurricanes and other tropical storms grow larger, with heavier rains and stronger winds. (http://www.epa.gov/climatestudents/impacts/signs/weather.html) http://www.bing.com/images/search?q=lightning&qs=n&form=QBIR&pq=lightning&sc=8-8&sp=1&sk=&adlt=strict#view=detail&id=7F2F1380DC8185E2FE518FA956023D38D9C6A9C4&selectedIndex=5 http://www.epa.gov/climatestudents/impacts/signs/weather.html https://www.google.com/search?q=stormy+ocean&tbm=isch&tbo=u&source=univ&sa=X&ei=cPhgU4KPC6LesATohIC4Dw&ved=0CCoQsAQ&biw=1024&bih=673#facrc=_&imgdii=_&imgrc=JarlmWKysrwRPM%253A%3B90B7tUFPejG2iM%3Bhttp%253A%252F%252Fwallpoper.com%252Fimages%252F00%252F25%252F10%252F90%252Fstormy-ocean_00251090.jpg%3Bhttp%253A%252F%252Fwallpoper.com%252Fwallpaper%252Fstormy-ocean-251090%3B1920%3B1080
Lessons Learned STRENGTHS • Topic-” good student buy-in” • Enjoyable/challenging project format • REAL, meaningful data • Variety of scientific and non-scientific resources • Changed climate change perceptions Weaknesses • Make own graphics with data; not cut and paste • Projecting digital images did not work • Publish product on web so all students have access to ALL projects • Include more reading/writing- science literacy standards • Require map graphic with GIS technology
NEXT? • Start early developing skills needed to complete an awesome project. • Learn how to use infographic software. • Start long-term data collection project using EpiCollect • Set up climate change webpage. • Climate Change Unit “Part B”: Solutions for a Global Challenge