Download
1 / 93
930 likes | 936 Views
Clatsop Pacific Coordinated Care Organization (CCO) – Clatsop County Data Summary. Changes in Oregon Health Plan. Federal Accountable Act. Coordinated Care Organizations. Healthcare Coordination & Integration. Dual Eligibility. Metrics / Performance Measures. Community Advisory Councils.

E N D
Clatsop Pacific Coordinated Care Organization (CCO) – Clatsop County Data Summary
Changes in Oregon Health Plan Federal Accountable Act Coordinated Care Organizations Healthcare Coordination & Integration Dual Eligibility Metrics / Performance Measures Community Advisory Councils Global Budgets For All Primary Care Health Homes
OHP Client Oral Health Physical Health Mental Health Addictions TX • Assessment • Diagnosis • Treatment Plan (EBP) • Pre-set rate per service • Monitor / Update • Assessment • Diagnosis • Treatment Plan (EBP) • Pre-set rate per service • Monitor / Update • Assessment • Diagnosis • Treatment Plan (EBP) • Pre-set rate per service • Monitor / Update • Assessment • Diagnosis • Treatment Plan (EBP) • Pre-set rate per service • Monitor / Update
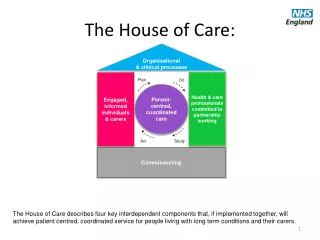
Coordinated Care Organizations Primary Care Health Homes – Center of patients’ coordinated care. Includes a team that works on keeping patients at their healthiest. • Local Control (different CCO models) • Coordination – Integrate Physical health, mental health, dental health– single point of accountability • Metrics / Performance Measures – Operate under contracted performance standards with clinical, financial and operational metrics • Global Budget And Shared Saving – More flexibility to manage dollars Community Advisory Council – Each CCO convenes a CAC to ensure that the health care needs of consumers are being addressed
CCO created a culture which allowed providers to bring these local activities into the next generation of integration Why This Why Now?
Better Health Care System Better Health Outcomes Cost Savings
Improve Health System, Improve Health Outcomes, Lower Costs At High Risk - Chronic Disease Chronic Disease All OHP Clients Early Assessment & Identification of High Risk For Chronic Disease Coordinated case management – Reduce likelihood become chronic Coordinated case management – Reduce high end costs
At High Risk - Chronic Disease Chronic Disease All OHP Clients Early Assessment & Identification of High Risk For Chronic Disease Coordinated case management – reduce likelihood become chronic Coordinated case management – Reduce high end costs
At High Risk - Chronic Disease Chronic Disease All OHP Clients Early Assessment & Identification of High Risk For Chronic Disease Coordinated case management – reduce likelihood become chronic Coordinated case management – Reduce high end costs
At High Risk - Chronic Disease Chronic Disease All OHP Clients Early Assessment & Identification of High Risk For Chronic Disease Coordinated case management – reduce likelihood become chronic Coordinated case management – Reduce high end costs REALLY? Savings = reinvestment into system – incentive, etc.
Cost Impact Sample – Using Diabetes for A Single Oregon County: Number of Persons: 9,300 Number of Deaths: 531 Costs: $42.6M If you can prevent 4.67% of people from getting Diabetes: If you can prevent 20% of people from getting Diabetes: 437 Number Prevented: 1,860 32 121 Lives Saved: Financial Cost Savings: $2 M $8.52 M
Cost Impact Sample – Using Diabetes for Douglas County: The risk of Type 2 Diabetes can be reduced by 50-70% by control of obesity And by 30-50% by increasing physical activity $8.52 Million Question: What is the likelihood of preventing 5%, 10%, 20% of population from getting Diabetes? If you can prevent 4.67% of people from getting Diabetes: If you can prevent 20% of people from getting Diabetes: Number Prevented: 437 1,860 Lives Saved: 32 121 Financial Cost Savings: $2 M $8.52 M
Personal impact cannot be quantified • Can apply model to other chronic diseases – Each has risk factors which increase the likelihood of illness: • Heart Disease and Stroke Prevention: • No tobacco • Physically active • Healthy weight • Healthy food choices • Preventing / controlling high blood pressure • 12 – 13 point reduction in average systolic blood pressure over 4 years reduces heart disease risk by 21%, stroke risk by 37% • Cancer Prevention: • No tobacco • Limiting alcohol • Limited exposure to ultraviolet rays • Diet rich in fruits and vegetables • Maintaining a health weight • Being physically active • Seeking regular medical care
PCP Addictions Mental Health Oral Health
Health Integration System Family Behavioral Health Mental Health Spiritual Community Patients Providers Dental Health Peers Physical Health Neighborhood Health
15 CCO management areas Community Advisory Councils – Ensure health care needs of consumers are being met. Community / consumer focus within CCO’s work to accomplish vision – Improve Health Care System, Improve Health Outcomes, Lower Costs Current Goal – Identify 3 priority areas to improve health then identify strategies to reach that goal
National / State Studies: • Higher death rates related to: • Heart disease • Stroke • Unintentional injuries • Higher death rate from drug induced causes • Slightly higher death rates related to alcohol induced diseases • Higher rates of: • DUII rates • Heavy drinking – female • Youth who use marijuana • Limited access to health foods • Higher rates of preventable hospital stays • Higher percentage of reporting of depression/anxiety and high blood pressure (CP CCO Medicaid data) Summary of Findings • Community Responses (Not in specific Order) • Conditions create a healthy community: • Jobs • Clean environment / Access to healthy foods • Affordable housing / Education – Schools • Health problems in community: • Alcohol / drug addiction • Obesity • Cancer • 3 things to improve community health: • Health education • Expand OHP • More doctors
Chronic Condition Diagnoses – Medicaid-eligible Population (CPCCO Service Area
Leading Cause of Death - Rate Per 100,000 (5 year average) 2007 – 2011 Cause Clatsop County Oregon 222.1 163.1 Heart Disease Stroke 67.4 47.9 Unintentional Injuries 41.9 57 14.3 16.2 Suicide
Percent of Youth Who Had Drank Alcohol Past 30 Days (11th Grade)
Percent of Youth Who Binge Drink in the Past 30 Days (11th Grade)
Percent of Youth Who Drove When Drinking Alcohol (11th Grade)
Percent Who Used Illicit Drug(s) Other Than Marijuana in Past 30 Days
Percent of Youth Who Used Marijuana In Past 30 Days (11th Grade)
Percent of Youth Who Attempted Suicide in the Past Year (11th Grade)
Percent of Youth Who Had Depressive Episode in the Past Year (11th Grade)