Download
1 / 7
70 likes | 325 Views
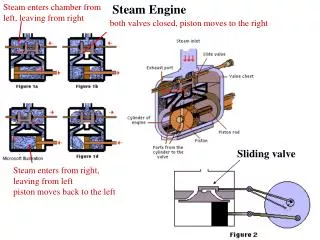
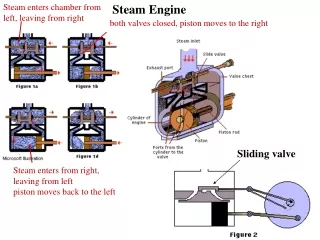
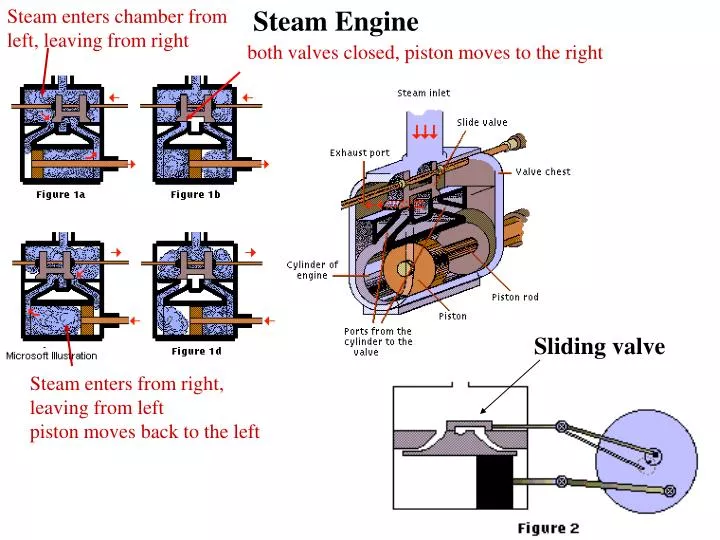
Steam enters chamber from left, leaving from right. Steam Engine. both valves closed, piston moves to the right. Sliding valve. Steam enters from right, leaving from left piston moves back to the left. Thermodynamics Properties.

E N D
Steam enters chamber from left, leaving from right Steam Engine both valves closed, piston moves to the right Sliding valve Steam enters from right, leaving from left piston moves back to the left
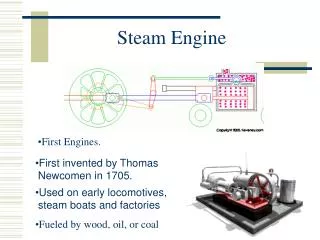
Thermodynamics Properties Two independent properties are needed to define the state of a pure substance (Ch. 2, YAC) Pure Substance: A homogeneous substance with a fixed chemical composition. Does not have to be a single element or in a single phase. Helium, Nitrogen, Water, Sulfur-di-Oxide are pure substances. Pressure (p), Temperature (T), specific volume (v) internal energy (u) and enthalpy (h) are among the most common thermodynamic properties. The variation or behavior of properties of a pure substance and their relationship to each other is most commonly and easily examined viaproperty diagrams and property tables. Property diagrams are also used to analyze the thermodynamic processes in thermal systems and thermodynamic cycles under which many systems operate. Thremo Porperties-1.ppt
Simple steam power plant cycle Heat in Work out Property Diagram Heat in Work out Work in by pump Condensing back to liquid for easy transportation Heat out to cooling water
Phase Change Constant pressure process Superheated steam (or vapor) Above critical point, there is no clear distinction between liquid and vapor phases Saturated water liquid+vapor Saturated (liquid+vapor) Melting Compressed (subcooled) liquid vaporization sublimation
T v p T p Constant pressure line Constant temperature lines v
(a) P-v diagram: Along the constant temperature line, increasing vapor pressure will lead to higher density (lower specific volume) due to compression. After it reaches the saturation pressure at that temperature, the vapor will condense into liquid while the pressure remains constant until all vapor condense into liquid. (b) T-v diagram: Along the constant pressure line, increasing liquid temperature will lead to lower density (higher specific volume) due to thermal expansion. At the saturation temperature, the liquid will vaporize into gaseous form at a constant pressure until all liquid vaporize.
Melting/freezing p (c)P-T phase diagram Substances that contract on freezing Substances that expand on freezing ex. Water. Higher pressure makes it more difficult to freeze, thus requiring lower freezing temperature. The reverse is true for substances that contract on freezing Critical point liquid solid Vaporization/condensation vapor T Triple point: all three phases coexist in equilibrium Sublimation Vaporization: As pressure goes down, vaporization occurs at lower temps That’s why water boils at lower temperatures at higher elevations. Critical point: A limiting state above which there is no clear distinction between liquid and vapor phases.