Download
1 / 38
380 likes | 568 Views
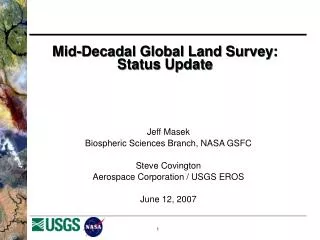
Mid-Decadal Global Land Survey. Jeff Masek Biospheric Sciences Branch, NASA GSFC Steve Covington Aerospace Corporation / USGS January 10, 2007. Mid-Decadal Global Land Survey (MDGLS).

E N D
Mid-Decadal Global Land Survey Jeff Masek Biospheric Sciences Branch, NASA GSFC Steve Covington Aerospace Corporation / USGS January 10, 2007
Mid-Decadal Global Land Survey (MDGLS) Follow-on to the GeoCover orthorectified global data sets (1975, 1990, and 2000 epochs) centered on 2004-2006 • Partnership between USGS and NASA, in support of CCSP • Support global assessments of land-cover, land-cover change, and ecosystem dynamics (disturbance, vegetation health, etc) • Landsat-5 TM and Landsat-7 imagery, with ASTER and EO-1 ALI data as needed
Land Cover Change Earth Science Data Record • Routine monitoring of global land cover conditions on 1-5 year time scales has been a documented science priority: • US Climate Change Science Program (CCSP) • NASA Earth Science Research Strategy • CEOS GOFC/GOLD Program • Global Land Program (GLP) The MDGLS dataset offers a “pilot” opportunity to assess global rates of land cover change for 2000-2005
MDGLS Development • Phase 1: identify all candidate scenes and ingest into the USGS archive (USGS lead) • Phase 2: Process selected data into an ortho-rectified dataset compatible with previous surveys (NASA lead) • Phase 3: Analyze data set to quantify trends in land cover and vegetation dynamics (NASA LCLUC)
Mid-Decadal Global Land Survey (MDGLS) Phase I: Identify and Acquire L5 and L7 Data Phase II: Process MDGLS Data Phase III: Analyze MDGLS Dataset for Land Cover/ Land Cover Change
Where do we want data? Green = GeoCover 2000 Coverage Red = New MDGLS Coverage
When do we want data? Green = NH Summer (Jun, Jul, Aug, Sep) Red=NH Spring (Apr, May) Violet=NH Fall (Oct, Nov) Yellow=NH Winter (Jan, Feb, Mar, Dec)
What data are available? Landsat-7 Green = Base ≤ 1% CC, Fill≤ 5% CC Yellow = Base ≤ 5% CC, Fill≤ 10% CC 3 month acquisition windows, 95% fill coverage
L5 TM Coverage Archived at EROS with Cloud Cover < 10% Yellow = 2005 Coverage Green = 2006 Coverage Red = 2004 Coverage
L5 TM Coverage Archived outside EROS Yellow = 2005 Coverage Green = 2006 Coverage Red = 2004 Coverage
Combined Archived Coverage in EROS Archive >91% of the P/R Locations Covered Green = ETM+ 5%/10% CC Fill Yellow = TM <10% CC in EROS Archive Red = TM = ??% CC in IC Archives
Phase 1 Status • Phase 1: satellite tasking, ground station coordination, scene selection, data transfer, and ingest into the USGS archive • Since December 2005 • Developed and implemented an MDGLS acquisition strategy • Developed QA management tool and automated scene selection tool • Established a network of 6 campaign stations to collect Landsat 5 data • 3 have provided data (Kiruna, Moscow, Irkutsk) • 1 is under construction and will begin collections in early 2007 (Chetumal) • 1 is currently running certification (Maspalomas) • 1 is uncertain (Malindi) • Most International Cooperators have agreed to supply image data in support of the MDGLS Project • 6 have provided metadata to USGS • 6 stations have confirmed Jpeg browse – for easier inspection
Mid-Decadal Global Land Survey (MDGLS) Phase I: Identify and Acquire L5 and L7 Data Phase II: Process MDGLS Data Phase III: Analyze MDGLS Dataset for Land Cover/ Land Cover Change
Phase II Tasks • Establish MDGLS Product Specifications • Select data source and scenes (where multiple options are available) • Process selected data • - Orthorectification • - Gap-filling (for Landsat-7) • - Product format • Distribute MDGLS data • Complete dataset available Fall 2008
Data Source Selection: Issues Landsat-7 Landsat-5 • No gaps • L7 gap filling can result in radiometric artifacts • L5 calibration improved for ~2000 to present • Better radiometry • 60m TIR band, pan band • Gaps can be filled in cloud-free conditions Tested ETM+ gap-filled products for change detection - Jim Vogelmann – mapping pivot irrigation - Matt Hansen – tropical deforestation - Chengquan Huang – temperate forest disturbance
Landsat-7 Gap-filling: The Good Northern Siberia (p159r15) primary fill EROS Gap-filling works very well in cloud free conditions
2005L5-1999GeoCover Example: 1999-2005 forest disturbance, VA Towards SE of scene edge, no obvious visual artifacts in gap filled areas Overall agreement = (145710/160000) 91.0687% Agreement matrix 2005L7GF-1999GeoCover
Jim Vogelmann: Pivot irrigation mapping Mapped change in pivot irrigation using 1989 Geocover image and… - 2004 “Best” Landsat-5 TM - 2006 Gap-filled ETM+ 1989: 1,741,858 pixels pivot irrigation 2006 Gap-filled: 1,938,525 (95.5% of 2004 TM estimate) 2004 TM 2,029,047 “my guess is that some of the differences that we are seeing between 2004 and 2006 are related more to seasonal and/or image date differences (some of the pivots are easier to discern than others depending on seasonal conditions and the dates of the imagery used) than due to differences in the type of imagery used (e.g., L7 gap filled vs L5). Using the methods that I used, the gap-filled imagery was just fine. ” Using just the non-filled ETM+ (ie. with gaps) as a statistical sample, and compensating for the fraction of the scene missed by gaps, he estimated the number of pivot pixels in 2006 as 1,869,332 = 96.4% of the number derived from the gap-filled image.
Pivots 1989 only Pivots 1989 and 2004/6 Pivots only 2004/6
A Center pivots from “A” w/o gap- filling Center pivots derived from “A” Portion of 2006 Gap-filled scene
Landsat-7 Gap-filling: The Bad and the Ugly Honduras (p18r50) residual gap primary fill Gap-filling with cloudy scenes can introduce radiometric artifacts; small residual gaps are possible
2005L5-1999GeoCover Example: 1999-2005 forest disturbance, VA Towards SW of scene edge, gap filled with cloud/shadow contaminated pixels Overall agreement = (123482/158223) 78.0430% Agreement matrix 2005L7GF-1999GeoCover
Data Source Selection: Status Recommendation: - For cloud-free scenes (<2% CC): lean toward Landsat-7 ETM+ - Cloudier scenes (2-10% CC): lean toward Landsat-5 TM - Humid Tropics: multiple acquisitions for compositing Sensor choice must be balanced against acquisition date, overall cloud cover, and acquisition date of 2000 Geocover - Optimization algorithm being developed to assist selection
Scene Selection • Joint effort to fund development of an selection tool which will compute the optimal population of scenes to cover a geographic area based on user-provided criteria and weightings • How it works: • Schedule • AMES Planning and Scheduling Group to do development • V.1 Prototype output due in December (completed) • V.2 Prototype to be delivered in late-January • V1 Operational system due in February Seasonality Adjacent Temporal Evaluation Sensor-Type List of scenes making the best map Population of candidate scenes Assessed Cloud Cover Gap-fill Potential Geo-Cover Acq. Date
MDGLS Orthorectification • What is the geodetic accuracy of the current GeoCover 2000 product? Three studies have been conducted: • Earthsat: Checked against Landsat-7 ETM+ definitive ephemeris imagery. Overall accuracy of ~40m RMS. • - does not include any error due to DEM selection • NASA SSC: Withheld NGA control from bulk triangulation for later accuracy check. Overall absolute accuracy of ~50m RMS • -NGA control not uniformly distributed; lacking in high-relief areas • UMD comparison with SRTM shaded relief images • Flagged some large errors in South America, British Columbia • Limited by resolution of available SRTM data (90m) • Most areas indicated <90m error relative to SRTM.
MDGLS Orthorectification Need to reprocess previous GeoCover datasets in high-relief areas to maintain continuity with MDGLS - model absolute error due to Geocover DEM choice - reprocess locations with errors >15m using SRTM Use 2000 GeoCover chips as geodetic control, SRTM DEM for terrain correction - L7 automated 1Gt processing available Feb 2007 (?) - L5 automated 1Gt processing available late 2007 (?) Geodetic accuracy relative to 2000 Geocover of 30m RMSE (or better). Maximum absolute geodetic error of 100m.
MDGLS Product Specification (Draft) • UTM / WGS-84 projection • 14.25 / 28.5/ 57 meter resolution • Cubic Convolution resampling (1 step) • GeoTiff format • Orthorectified, Gap-filled • Processing by USGS EROS • FTP distribution of individual MDGLS scenes at no cost, with limited provision for bulk distribution of entire dataset (e.g. via hard disk transfer).
MDGLS Schedule Image Acquisition Phase 1 Activities IC* Metadata Collection Scene Selection IC Data Collection Phase 2 Activities Phase 2 Planning Product Generation Product Generation Prime Acquisition Period CY 2004 CY 2005 CY 2006 CY 2007 CY 2008 *IC = International Cooperator
MDGLS Processing Issues • Cost • Schedule
Mid-Decadal Global Land Survey (MDGLS) Phase I: Identify and Acquire L5 and L7 Data Phase II: Process MDGLS Data Phase III: Analyze MDGLS Dataset for Land Cover/ Land Cover Change
Recommended Approaches Produce products via independent teams, but coordinate tools and class definitions - regional to continental scales - thematic products Prioritize regions with known LC dynamics of critical import for carbon, water, biodiversity, and societal services Land cover is necessary but not sufficient; include vegetation dynamics (disturbance, recovery, fragmentation, biome migration, etc). Establish concurrent validation program Workshop in Annapolis Maryland, February 27-28 2007
MDGLS Web Site (draft) http://lcluc.umd.edu/mdgls/index.html
Survey Epoch To provide an adequate basis for assessing land cover change, the MDGLS shall include data from 2004-2007, with greatest emphasis on data from 2005-2006. Survey Density At least one image or ETM+ composite pair shall be supplied for all path-row locations between 60deg N and 60deg S. Pole-ward of these limits, the survey may include every other row due to scene overlap. More than one image or composite pair shall be supplied for areas of persistent cloud cover (see 2.4). Survey Seasonality To the greatest extent possible, the MDGLS shall acquire data from (in order of preference) (1) periods of peak vegetation greenness and (2) periods similar to the seasonality for the corresponding scene from the 2000 Geocover dataset. In cases where these objectives are not compatible, preference shall be given to acquiring imagery from peak greenness conditions. Allowable Cloud Cover All images within the MDGLS shall have a maximum of 15% cloud cover. In cases where no single image or ETM+ composite pair from the 2004-2007 epoch has cloud cover less than 15%, additional images shall be supplied to facilitate compositing by end users. Sensor Choice Landsat-7 ETM+ shall be preferred for all cloud-free (< 2% cloud cover) regions. For those locations where a cloud-free ETM+ composite pair does not exist, Landsat-5 TM shall be preferred if a substantially clear TM scene exists (<15% cloud cover). EO-1 ALI shall be preferred for small islands and reefs. Areas with no acceptable Landsat coverage shall be filled in using ASTER or EO-1 ALI data.
MDGLS Geodetic Accuracy MDGLS scenes shall be terrain corrected to an geodetic accuracy of 30m net RMSE (TBR) relative to the 2000 Geocover dataset. The maximum geodetic error within the MDGLS shall be less than 100m. Note: this assumes that the 2000 Geocover are first reprocessed using SRTM 30/90m data. ETM+ Gap Filled Products Cloud-free MDGLS products derived from ETM+ shall be gap-filled using the EROS “local linear histogram matching” algorithm using a pair SLC-off images acquired from the same season. The product shall include the gap-filled composite together with a mask indicating the extent of the original data versus the fill data. {TBR: In cases where ETM+ data are used, and the cloud cover of any single SLC-off image is greater than 5%, the orthorectified SLC-off images will be distributed separately without gap filling} Product Projection MDGLS products shall be in UTM/WGS-84 projection. For images that include multiple UTM zones, the MDGLS zone shall correspond to that used for the corresponding Geocover 2000 product. Product Resolution and Resampling MDGLS products shall have a spatial resolution (pixel size) of 14.25m (panchromatic band), 28.5m (reflective multispectral bands), and 57m (thermal band). Only cubic convolution resampling shall be used during MDGLS processing. Product Format MDGLS products shall be formatted using GeoTiff, and include all structural, science, geographic, and processing metadata in a separate file, including metadata from multiple input scenes in the case of ETM+ gap-filled products.