Download
1 / 4
40 likes | 154 Views
PART II. How does geography play a role in water distribution ?

E N D
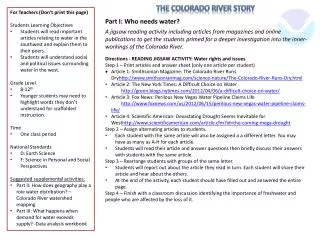
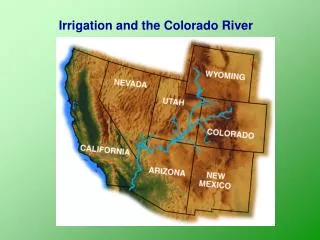
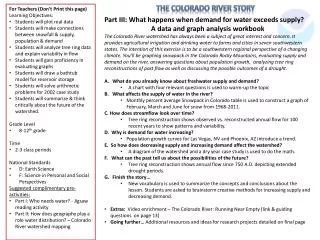
PART II. How does geography play a role in water distribution? In order to understand the dynamics of water and issues relating to the Colorado River watershed, students will make map models of stream flow and precipitation including population of cities and towns in and around the Colorado River Basin. • For Teachers (Don’t print this page) • Students Learning Objectives • Students will visualize and map the most important southwestern watershed • Students will create their own methods for plotting mapdata • Students will make connections between altitude, geography, precipitation & streamflow • Grade Level • 8-12thgrade • Time • 1-1.5 class periods • National Standards • D: Earth Science • F: Science in Personal and Social Perspectives • Suggested supplemental activities: • Part I: Who needs water? - Jigsaw reading • Part III: What happens when demand exceeds supply? - Data analysis workbook • Materials: • Colored pencils and/or markers • Table 1: Average Annual Flow Rates (following page) • Table 2: City population and average precipitation (following page) • Map of the southwest U.S. (following page) • Directions: • Intro: Begin with a classroom guided brainstorming discussion using these prompts: (You may want to provide pictures of rivers and basins) • Where does your water come from? • How does changing altitude/elevation affect a river • What are different kinds of precipitation? • Where does precipitation happen most and least? • Is population evenly distributed across the U.S.? • Activity: Where does freshwater come from and where do people live? • Print the following three pages for each student. • Directions for mapping and questions for connecting the data plotted on the map are included. The Colorado River Story
Where does freshwater come from and where do people live? • Rivers and towns in and around the Colorado River basin are already labeled on the map provided. • Plot the information from Tables 1&2 on the map by choosing symbols to represent streamflow, population and precipitation. • For example, you may choose to use a blue dot to indicate 1 million acre feet (MAF) and a red dot to indicate 500,000 million acre feet (MAF). Therefore, next to Colorado River at the Mexico border you would put 1 blue dot and 1red dot. Then you would choose a different symbol to represent population and precipitation. • Make a legend for your symbols. • Answer questions about your map. *1 million acre-foot is how much water it would take to flood an acre with a foot of standing water Table 1 Streamflow data, courtesy of Dr. David Yates, NCAR/UCAR Table 1 Populaton data courtesy of wikipedia.com Table 2 Precipitation data courtesy of usclimatedata.com
Refer to your map to answer the following questions with complete sentences. Name: Period • What does the color-shading on the map indicate? How does it change through the river basin? • What do the headwaters for all the rivers on the map have in common? • Does the Colorado River flow past Denver? Which direction does the Colorado River flow? • Which direction does the Arkansas River flow? How can you tell? • Where is the precipitation the highest? What do you think might affect precipitation amounts? • Where is population the highest on your map? Is this the same area where the streamflow is highest? • In a sentence or two, explain the role of geography in natural water distribution according to your map.