Download
1 / 16
220 likes | 388 Views
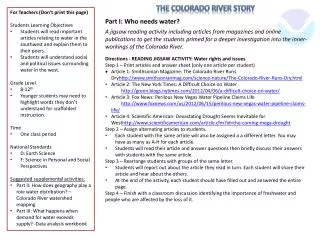
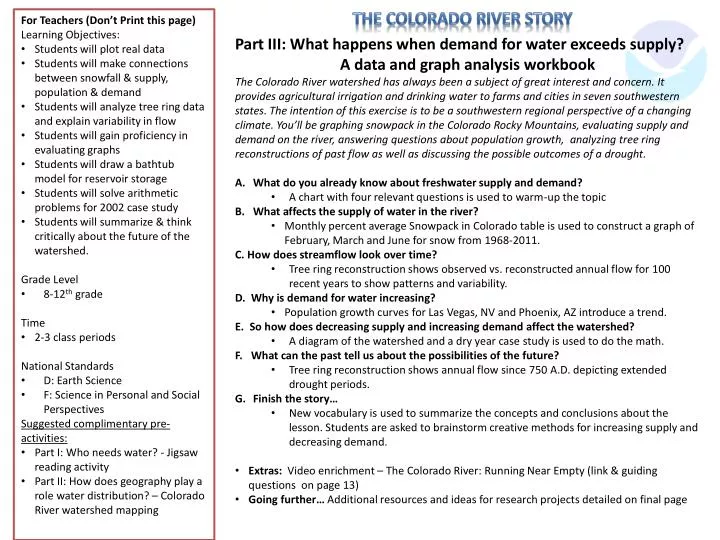
Part III: What happens when demand for water exceeds supply? A data and graph analysis workbook

E N D
Part III: What happens when demand for water exceeds supply? • A data and graph analysis workbook • The Colorado River watershed has always been a subject of great interest and concern. It provides agricultural irrigation and drinking water to farms and cities in seven southwestern states. The intention of this exercise is to be a southwestern regional perspective of a changing climate. You’ll be graphing snowpack in the Colorado Rocky Mountains, evaluating supply and demand on the river,answering questions about population growth, analyzing tree ring reconstructionsof past flow as well as discussing the possible outcomes of a drought. • What do you already know about freshwater supply and demand? • A chart with four relevant questions is used to warm-up the topic • What affects the supply of water in the river? • Monthly percent average Snowpack in Colorado table is used to construct a graph of February, March and June for snow from 1968-2011. • C. How does streamflow look over time? • Tree ring reconstruction shows observed vs. reconstructed annual flow for 100 recent years to show patterns and variability. • D. Why is demand for water increasing? • Population growth curves for Las Vegas, NV and Phoenix, AZ introduce a trend. • E. So how does decreasing supply and increasing demand affect the watershed? • A diagram of the watershed and a dry year case study is used to do the math. • F. What can the past tell us about the possibilities of the future? • Tree ring reconstruction shows annual flow since 750 A.D. depicting extended drought periods. • Finish the story… • New vocabulary is used to summarize the concepts and conclusions about the lesson. Students are asked to brainstorm creative methods for increasing supply and decreasing demand. • Extras: Video enrichment – The Colorado River: Running Near Empty (link & guiding questions on page 13) • Going further… Additional resources and ideas for research projects detailed on final page • For Teachers (Don’t Print this page) • Learning Objectives: • Students will plot real data • Students will make connections between snowfall & supply, population & demand • Students will analyze tree ring data and explain variability in flow • Students will gain proficiency in evaluating graphs • Students will draw a bathtub model for reservoir storage • Students will solve arithmetic problems for 2002 case study • Students will summarize & think critically about the future of the watershed. • Grade Level • 8-12thgrade • Time • 2-3 class periods • National Standards • D: Earth Science • F: Science in Personal and Social Perspectives • Suggested complimentary pre- activities: • Part I: Who needs water? - Jigsaw reading activity • Part II: How does geography play a role water distribution? – Colorado River watershed mapping The Colorado River Story
Teachers: How to use Part III (don’t print this page) • The main objective of Part III is to tell the story of the Colorado River Watershed, the most important water supply in the southwest, through data investigations of supply and demand. The lesson is intended to help students understand the science behind the issues concerningthe Colorado River water supply. • Part III: Navigation and objectives: • Print pages 1-12 for each student or one for each group of students you choose. • Page 1 – Start them thinking. The students will first explore their own knowledge of factors that affect a water supply with questions that they should be able to answer in more detail in the exercises to follow. You may want to have the students fill out the first column and complete the second before they summarize in the assessment. • Pages 2-4–Decreasing supply. The students will complete a scatter plot for one month from the tables for 1968-2011 on the blank graph provided. You may want to review watershed geography: mountainous headwaters of a river being the source and connecting snowpack towater supply downriver. They may also need help with drawing a trend line through their variable scatter plots. Melting water earlier affects the summer water supply. A considerable drop in snowpack in the winter would cause a drought. The graph of increasing temperature in the analysis questions should lead them to a connection between rising temperatures and falling snowpack. • Page 5 – Investigation of past supply. A brief explanation of streamflow relating to supply, scientist’s proxies of the past, and a compact that determined how much water would be shared. Yes/No data analysis questions of the tree ring reconstruction with measured observation graph from the last one hundred years of annual flow. This exercise should reveal the difficult decision engineers had to make when assuming water supply given fewer years of data than we have now thanks to trees. You may consider a background reading on tree rings from Dr. Randy Russell (UCAR): http://eo.ucar.edu/staff/rrussell/climate/paleoclimate/dendrochronology.html • Page 6 – Increasing demand. The students will practice reading graphs by answering T/F questions relating to dramatic population growth curves that are causing an increase in the demand on the river. • Page 7- 10– Supply vs. Demand. The top diagram provides the concepts of the water cycle and geography in the Colorado River necessary for the students to complete the simple math problems for the 2002 case study. The understanding should be that during dry years, there is not enough water to meet demands. The allocations were decided in the Colorado River Compact of 1922. • Page 11 – The possibilities of the future. A longer reconstruction of tree ring evidence shows 1250 years of streamflow and occurrences of mega-droughts, students will use this to estimate drought and time. Precipitation predictions of the future are difficult to do, some places will be wetter. However, it is agreed that the southwest has seen patterns from the past that hotter means drier. • Page 12 – Put it all together. The students will use the vocabulary provided to summarize their new knowledge and provide ideas for changing the possible outcome. There is a prompt at the end to encourage group brainstorming for creative solutions. • Page 13 - A question sheet is provided for the video enrichment, if you choose to use it. • Going further is a section with teacher suggestions for projects topics, which dive further into the story. Extended activities for exploring solutions are always recommended.
A. What do you already know about freshwater supply and demand? • Take a few minutes and fill out the blank column on the left before beginning the activity. Fill in the column on the right before you write a summary of what you have learned on the final page of the workbook.
B. What affects the supply of water in the river each year? Tables 1 shows monthly percentages of average snowpack in CO. May has already been graphed on the next page to show a trend in spring average snowpack from 1968-2011. Choose a month, plot it, and add a line showing the trend. Don’t forget to label your graph. Data gathered from NRCS – US Dept of Agriculture – Basin wide Snowpack Percentages
Graph 1: Average snowpack in May, Colorado 1968-2011 Snow (inches) Snow (inches)
Answer the following questions with complete sentences using both graphs of snowpack. Would you say the amount of spring snowpack in the Rocky Mountains is consistent or variable year to year? What is the highest average in your plot between 1968-2011? What is the lowest average? Look at Graph 1, a trend of spring snowpack in May from 1968 to 2011. What does the line show? Explain. How would snow melting earlier in spring affect summer water supply? Why? What are some possible reasons why snow might melt earlier in spring in Colorado? Draw a temperature through time trend line through the data plot in the graph below then answer the question. Graph 3: Spring temperatures (°C) at SNOWTEL site Cascade in San Juan Mountain Range of the Rockies. Temperature ° C Year from 1986 - 2010
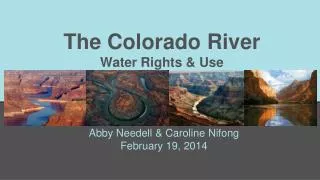
C. How does streamflow look over time? The word streamflow is used to describe the supply of water in the river. Streamflow is directly dependent on the amount of snowpack. If snowpack increases then streamflow also increases. People in the southwest depend on a certain amount of water to flow downriver. Scientists can look into the past with climate proxies, natural archives of climate information such as tree rings, ice cores, corals, lake and ocean sediments. The graph here shows the measured streamflow (observed) compared to streamflow according to tree ring evidence (reconstructed). In 1922 the State of Colorado signed onto a compact with six other western states (Arizona, California, Nevada, New Mexico, Utah and Wyoming). When the Colorado River Pact of 1922 was signed, engineers and scientists used about 20 years of data to decide how much water was in the river each year. MAF is a million acre-foot, a measurement of streamflow. Use the graph to answer with yes or no to the following questions. Do you think that the tree ring reconstruction accurately reflects the amount of flow measured from 1905-2005? If you were a water manager determining the average flow of the river in 1922, would 15 MAF be a safe estimate from 1905-1925? If you were a water manager determining the average flow of the river in 1980, would 15 MAF be a safe estimate from 1960-1980? Would you say that the streamflow varies a lot from year to year? This graph shows supply of water in the river. Would a graph of demand on water through time look the same? Tree ring graph courtesy of Dr. Connie Woodhouse, et al, treeflow.info
D. Why is demand for water increasing? Since the 1922 Colorado River Compact, the human populations in the participating seven states have skyrocketed. Nevada, Arizona, Colorado and Utah are the top four states in the nation in terms of population growth. This increase in population and the added risk of rising temperatures are putting stress on the river’s ability to provide enough water for these seven states and the people that live in them. Las Vegas, NV Phoenix-Mesa, AZ Directions: Place a T for True or an F for False in the box to the left of the statement to be judged. Charts constructed using www.censusscope.org Phoenixwas growing faster between 1960 and 1970 than between 1990 and2000. There are more people in Las Vegas, NV than in Phoenix, AZ. The population of Las Vegas has grown more than 500% in the last 40 years. Answer the next couple questions based on what you may already know. Demand for water increases with increasing population. In 1960 there were about 750,000 people in Phoenix. Las Vegas grew faster between 1990 and 2000 than it did before that. The population of the entire U.S. is also increasing.
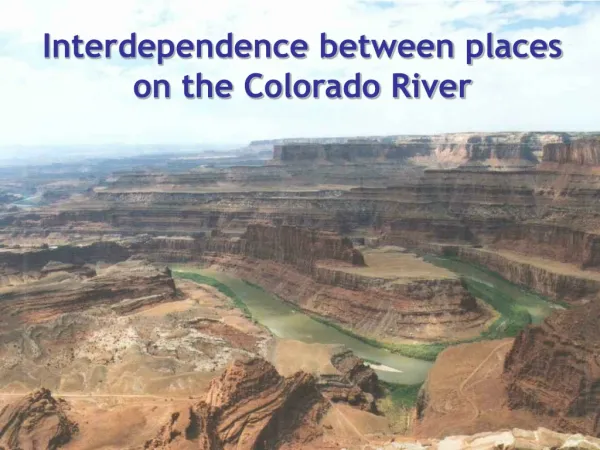
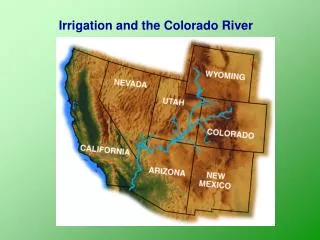
E. How does decreasing supply and increasing demand affect the watershed? The word watershed refers to an entire river system from beginning to end. The Colorado River watershed is depicted in the diagram below. The dotted line separates the upper and lower basins. Reservoirs are places where water reserves are stored. As we have seen from a previous graph, the Colorado River has different amounts of streamflowevery year. Reservoirs are used to store water in order to make up for the differences of yearly streamflow.You may recall that yearly streamflow is determined by the annual snowpack in the Rocky Mountains. For the reservoirs to stay the same or increase in level the inflow (supply) to the reservoir from the upper basin must be more than the outflow to the lower basin. Let’s see how that’s working. First, get familiar with the Colorado River watershed. Briefly answer the questions below. WY CO Upper Lower Green River UT Rocky Mountains Colorado River NV CA Evaporation loss Lake Powell San Juan River Lake Mead - - - - - - - - - - - - - - - - - - - - - - - - - - - - - - NM Inflow AZ Outflow What are the reservoirs called in the diagram? What factors affect the inflow to Lake Powell? What would cause the level of the reservoirs to go down? MEXICO
Let’s see what happens to the watershed during a dry year. The numbers in the diagramindicate streamflow in 2002. First, fill in the state boxes with the numbers from the table of 1922 Colorado River Pact state allocations. CO Upper WY Lower UT Green River 2.5 Rocky Mountains Colorado River 3.2 Inflow 4 0.8 0.4 NV CA Lake Powell San Juan River 0.5 Lake Mead Outflow 8 NM - - - - - - - - - - - - - - - - - - - - - - - - AZ MEXICO Use this diagram to complete the arithmetic problems on the next page.
Complete the problems below. You are given the equations. All answers should be in MAF, yes or no. • What was the change in storage (amount of water in the reservoir) at Lake Powell in 2002 if the loss due to evaporation was 0.4 MAF? (Inflow – outflow – evaporation = change in storage ) • a. If the average streamflow for the last 100 years is about 15 MAF, would there be enough water to cover the allocations to all 7 states and Mexico on an average year? (total Upper allocations + total Lower allocations = Total river allocations) Yes or No. b. What’s the difference? (15 MAF – Total river allocations) • a. What was the natural upper flow of the Upper Basin in 2002? (Colorado + Green + San Juan = upper flow) b. How much water did the Upper Basin actually use in 2002? (upper flow – inflow = use) • The amount allocated to the Upper Basin is7.5 MAF. How much less water did the Upper Basin use than was allocated to them? (7.5 MAF – use = difference) • a. The outflow from Lake Powell was 8 MAF in 2002 for the Lower Basin. Did the Lower Basin receive their allocated amount? (Outflow – total Lower allocations = difference) Yes or No. • What would have been the loss at Lake Powell if the Upper Basin had used their allocated amount of 7.5 MAF in 2002? 6.2 MAF - 7.5 MAF = ______MAF would have been the inflow. Since the value is less then 0 and 8 MAF would have been released to the Lower Basin in any case, then 8 MAF + 0.4 MAF of evaporation loss = ________ MAF of potential loss at Lake Powell in 2002. Because the Upper Basin did not use their allocated amount, the reservoir actually lost about 4.4 MAF, not ______MAF potential loss. Do you see where this is headed if the Upper Basin’s demand grows in the future? Explain.
Modeling the change in storage of reservoirs. From the last exercise you should have figured out that in a dry year, there is not enough water to meet demands on the river. The bathtub model is commonly used to show inequality in systems including a watershed. Draw a bathtub model for Lake Powell , which behaves similar to Lake Mead in the example below, using the 2002 example. Label inflow and outflow. Don’t use numbers, just adjust the size of the spouts coming in and going out of the bathtub and show the water level as compared to the drawing provided. Lake Mead Diagram: Tricia Mynster -www.camelclimatechange.org/resources/view/170549/
F. What can the past tell us about the possibilities of the future? Let’s look at another tree ring reconstruction of past streamflow. Not only do scientists use climate proxies, such as tree rings, to see patterns and variability of water supply but they also use the past in order to help prepare for the future. Use the reconstruction data in the graph to answer the questions. Tree ring reconstruction courtesy of Meko et al 2007 About how many more years are represented in this tree ring reconstruction than in the previous one we looked at? A severe and long-lasting drought (a long period of dry weather) is highlighted in the graph. Estimate how many years it lasted. Just by looking at the graph, would you say that 15 MAF is the average annual flow? If not, what would you estimate that it is? On the previous math exercise, you calculated that the natural flow during 2002 was only 6.2 MAF. Where would the line be for that year on this graph? What are some possible outcomes if the southwest were in a drought like the one highlighted in the graph? If increasing temperature causes the southwest to become drier, then what could we expect in the future as we see the temperature rising?
VOCABULARY: Snowpack, watershed, streamflow, supply, demand, treering reconstruction, temperature, population growth, drought, precipitation, evaporation, reservoirs, MAF (million acre-feet), allocations, use, 1922 Colorado River Compact, Lake Powell, Lake Mead G. Finish the story Once you’ve completed the questions chart on page 1, the vocabulary box can help you to construct a summary paragraph of what you have learned about the Colorado River watershed. • I just learned that…. ____________________________________________________________________________________________________________________________________________________________________________________________________________________________________________________________________________________________________________________________________________________________________________________________________________________________________________________________________________________________________________________________________________________________________________________________________________________________________________________________________________________________________________________________________________________________________________________________________________________________________________________________________________________________________________________________________ __________________________________________________________________________________________________________________________________________________________________________________________________________________________________________________________________________________________________________________________________________________________________________________________________________________________________________________________________ __________________________________________________________________________________________________________________________________________________________________________________________________________________________________________________________________________________________________________________________________________________________________________________________________________________________________________________________________ __________________________________________________________________________________________ • Lastly, think of some creative ways to increase supply and decrease demand and report out to your class.
Video Supplement:The Colorado River: Running Near Empty (http://e360.yale.edu/feature/video_colorado_river_running_near_empty/2443/) • Where did the writer and the photographer begin their journey? • What did Pete McBride mean by “straws drinking out of the river?” • What is the state of Colorado’s dilemma according to Pete McBride? • Which southwestern city pays its citizens to remove their grass lawns? Why do you think they are doing this? • Did Pete McBride and John Waterman reach the Sea of Cortez via the Colorado River?
Going further … • Consider more activities, research projects, or class presentations on the following topics: • 1922 Compact – The compact is only four pages but it outlines a very important natural resource. Reading and understanding it could be an introduction to the interpretation of politics and regulations. http://www.usbr.gov/lc/region/pao/pdfiles/crcompct.pdf • - A student-made video of the compact: http://www.youtube.com/watch?v=MZrKW-Q9X8E • Agriculture – One of the primary uses of the Colorado River in an arid west is for agriculture, nearly 75%. The Imperial & Coachella Valley are some of the most productive agriculture areas in the world with nearly 500,000 irrigated acres.http://www.crwua.org/ColoradoRiver/RiverUses/Agriculture.aspx • Conservation – Farming conservation practices can be seen in deserts across the world including Africa & the Middle East. Southwest U.S. farmers are being called to innovate into the future. http://southwestfarmpress.com/conservation-programs • Dendrochronology – Tree ring data has been monumental in discovering the suspected over-allocation of Colorado River water supply. Activity for exploring tree ring proxies is found here: http://www.ucar.edu/learn/1_2_2_11t.htm • Personal Use – An activity designed to individualize and recognize personal water use. Down the Drain: How Much Water Do You Use? (http://ciese.org/curriculum/drainproj/)