Download
1 / 25
250 likes | 253 Views
prefuse : A Toolkit for Interactive Information Visualization. Heer, J., Card, S.K., Landay, J.A. Presented by Julia West. A familiar visualization…. Problems. Not customized Need novel visualizations Could write our own Choose a visualization

E N D
prefuse: A Toolkit for Interactive Information Visualization Heer, J., Card, S.K., Landay, J.A. Presented by Julia West
Problems • Not customized • Need novel visualizations • Could write our own • Choose a visualization • Find/write algorithms for visualization and interaction • Spend weeks coding • Could utilize existing visualization “widgets” • Granularity at the level of the visualization • Same problem!
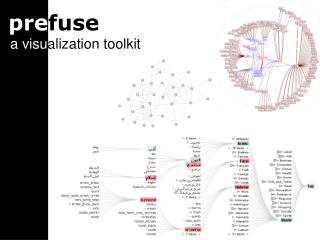
Enter prefuse… • Simplifies creation of visualizations • Flexible interface • Multiple views • Transforms • Customization • Time saver
Road-map • Design of prefuse • How to write applications with prefuse • Sample Applications • Usability Study
Data • Abstract Data Interfaces • Unstructured data • Graph data • Tree data • Entity type • Node • TreeNode • Edge • Input/Output
Visual Form • VisualItems • Node NodeItem • Edge EdgeItem • TreeNode AggregateItem ItemRegistry ItemRegistry NodeItems EdgeItems
Rendering • VisualItems are drawn to screen • Basic Shapes, edges, text, & images • Many Renderers, many views RendererFactory Renderer render(Graphics2D, VisualItem) getRenderer(VisualItem) getBounds(VisualItem) locatePoint(Point2D, VisualItem)
Display Component • Renders VisualItems to screen • Provides user interface callbacks • Supports tool tips, graphics transforms, on-screen text editing Data Set Abstract Data Entity VisualItem Filters Vis Vis Vis Renderer / Display View View View Controllers
Actions • Grouped into runnable ActionLists • Filter Actions • Filtering process • Assignment Actions • Visual Attributes • Animator Actions • Interpolation of start & end values
Writing Applications • Load Data & Create ItemRegistry • Create Renderers • Create ActionLists • Filter & Display • Animate • Create Display & Controls • Add Display to window & run ActionList
Writing Cooler Applications • Adding Force-Based Jitter • Adding Overview, Panning & Zooming • Adding Fisheye Distortion
Sample Applications • DOITree Web Hierarchy Browser
Vizster • Social networking visualization
Application Demos • prefuse homepage • Force-directed demo • Radial demo • Distortion demo • Auto-zoom demo
Usability Study • 8 participants • 4 CS students • 3 professional programmers and/or UI designers • 1 infovis expert • Pretest: brief tutorial • Windows PC with Eclipse IDE, prefuse source code, examples, & documentation • “Think Aloud”
Usability Study continued • Given social networking data file • Tasks • Create a static visualization of data using random layout • Use layout technique of choice and implement color scheme • Add interactivity and animation
Usability Study Results • All successfully created visualization • 7/8 completed all tasks • Problems with structuring data flow • Naming issues • API usage patterns – most help from examples, not documentation
Conclusion • Easily create novel visualizations • Problem • Data preparation • Questions