Download
1 / 43
430 likes | 570 Views
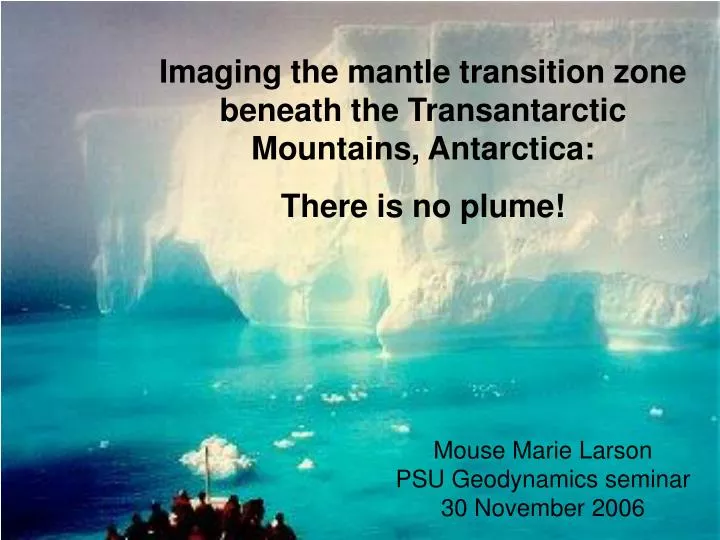
Imaging the mantle transition zone beneath the Transantarctic Mountains, Antarctica: There is no plume!. Mouse Marie Larson PSU Geodynamics seminar 30 November 2006. Acknowledgements Thanks to: Andy Nyblade Maggie Benoit Tim Watson Paul Winberry. Talk outline.

E N D
Imaging the mantle transition zone beneath the Transantarctic Mountains, Antarctica: There is no plume! Mouse Marie Larson PSU Geodynamics seminar 30 November 2006
Acknowledgements Thanks to: Andy Nyblade Maggie Benoit Tim Watson Paul Winberry
Talk outline What’s the point/Backgroud How Results Weird Results?!? What does it mean?
This study uses receiver functions to place depth constraints on any thermal anomaly beneath the TAMs The main question addressed here: Is there evidence for thinning of the transition zone between the 410 and 660? No http://home.freeuk.com/gtlloyd/tam/main.htm
East and West Antarctica are geologically distinct Modified from Anderson (1999)
Geologic Overview-I • The West Antarctic Rift System (WARS) • Extensional tectonism since the Jurassic (Dalziel and Lawver, 2001). • Previous studies estimate crustal thickness between 18-25 km.
Geologic Overview-II • The East Antarctic Craton (EAC) • Stable Precambrian shield • Unusually topographically high, >1km (Cogley, 1984) • Thicker crust, 35-40km
Geologic Overview-III • The Transantarctic Mountains (TAM) • Geologic boundary between the EAC and the WARS • The mountains extend ~3500km and reach heights of 4500m • Lack evidence of compressional tectonics.
Many different mechanisms have been proposed for creating the tectonic features of Antarctica http://mitglied.lycos.de/mapu2001/dryvalleys.html
Tectonic Models • Isostatic uplift induced by crustal thickening and hot mantle (Fitzgerald et al, 1986)
Tectonic Models • Decoupling between EA and WARS lithosphere in response to transtensional plate motion @ 61-53 Ma (ten Brink et al, 1997) • Flexural uplift of a broken plate supported by a thermal load (Stern and ten Brink, 1989; ten Brink and Stern, 1992)
Tectonic Models • Flexural uplift of a continuous plate. Crustal thickening during Ross Orogeny and then erosion induced uplift @ c. 55 Ma triggered by climate change. (Karner et al, 2005 and Studinger et al, 2004)
Previous studies show a negative anomaly beneath the Ross Sea at 300 km Seiminski et al, 2003
Ok, so what am I going to do? From Brian White’s TAMSEIS photos
Clapeyron Slopes Phase transformation at ~ 410 km Phase transformation at ~660 km Bina and Helffrich, 1994
The thermal anomalies affect the depth of the major phase transformations Lebedev et al, 2002
TAMSEIS The Transantarctic Mountains Seismic Experiment (2000 - 2003) included 41 portable broadband seismometers http://epsc.wustl.edu/admin/whatsnew/tamseis/
Three arrays: Coastal array North array East array http://epsc.wustl.edu/admin/whatsnew/tamseis/
Receiver functions generated using Ammon’s water level-deconvolution code and stacked using Owen’s stacking codes. http://eqseis.geosc.psu.edu/~cammon/HTML/RftnDocs/rftn01.html http://epsc.wustl.edu/admin/whatsnew/tamseis/
Geographical binning reduces bias based on azimuth latitude longitude
Each bin table is populated by the names of station/event pairs for which the wave passed through that node as well as the time that this occurs Station1-eventA Station1-eventG Station3-eventA, etc t*
Maps of the points show the lateral extent of the ray sampling from teleseismic events 410 km cross-sectional slice 660 km cross-sectional slice
TZT=260km Some results
? ? ? North South
? ? ?
The average global thickness of the mantle transition zone is 242 +/- 2km - Lawrence and Shearer 2006
Preliminary Results: The average transition zone thickness is greater than 250 km (the global average) -- currently no evidence for a plume or thermal anomaly in the transition zone AND The ice layer may be causing the double peak…more study is needed. http://home.freeuk.com/gtlloyd/tam/main.htm