Download
1 / 60
600 likes | 607 Views
North Central State College. Utilizing Board Ends Policies to Drive Student Success. ACCT Presentation October 4, 2013. Agenda.

E N D
North Central State College Utilizing Board Ends Policies to Drive Student Success ACCT Presentation October 4, 2013
Agenda I. Introduction and Overview - Steve Stone A. Workshop Objectives and Outcomes B. College Demographics C. Ends Policies and Change in Board Meeting FocusII. Translating Ends Policies to Strategic Plan and Metrics - Dwight McElfresh A. Vision/Mission B. Strategic Goals C. Metrics, Assessment Tools, and BaselinesIII. Operationalizing the strategic plan using data for student success- Dorey Diab A. Detailed sub-goals B. Changing roles of administration, faculty and staff C. Detailed metrics for student success
Agenda I. Introduction and Overview - Steve Stone A. Workshop Objectives and Outcomes B. College Demographics C. Ends Policies and Change in Board Meeting Focus
I. Workshop Objectives and Outcomes A. Provide College Environment Background B. Explain Carver Model and Establishment of Ends Policies C. Describe Alignment of Ends Policies and Strategic Plan D. Describe How to Drive Student Success by Aligning Metrics with Strategic Plan
Demographics - Located in north central Ohio - Serves the three-county district of - Ashland, Crawford & Richland - Population = 218,000
Fall 2013 Student Demographics Total enrollment: 2,958 Full Time Equivalent: 1,712 Average age: 27.5 (post high school) Full-time: 28% Female: 62% Minority at college (3 counties): 10% In Richland County: 12%
About the Board Appointed by the Local BOE = 6 Appointed by the Governor = 3 Total seats on the BOT 9 Current Board Composition Ashland County = (2) Locally Appointed, (1) Governor Appointed Crawford County = (2) Locally Appointed, (1) Governor Appointed Richland County = (2) Locally Appointed, (1) Governor Appointed
How the model was brought to the college community 1. First Introduced & Adopted (April ‘03) - Recommitted & Revitalized (January ‘09) 2. Official training of internal facilitator - by John & Miriam Carver (March ‘09) 3. Training of Board & President’s Staff (July ‘09) - by Miriam Carver 4. Policy Development Workshop (March ‘10) - by Miriam Carver
It clarifies roles and responsibilities of the Board & the President
It clarifies roles and responsibilitiesof the Boards & of the President
It provides a framework to ensure accountability of the Board and of the President
It starts with a Vision Moves to ENDS policies And then requires processes to operationalize the ENDS in order to measure progress toward achieving those ENDS
Board Tasks 1. Identify and define the ENDS policies A. Gain insights to “Owner’s Voice” 2. Policy Development, Adoption, and Implementation A. Complete Policy Re-write & Adoption (Jul. - Aug. ‘10) 3. Requirements A. Commitment of time and other resources B. Stakeholder engagement (internal and external)
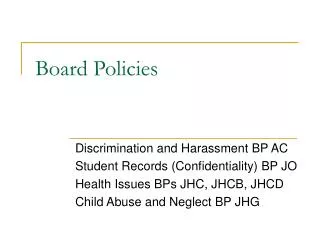
Board Ends Policies • Equal opportunity/diversity • Job readiness • High demand / emerging technologies • Career development • Transferability • Enrichment
Equal Opportunity/Diversity The proportion of students from economically or educationallydisadvantaged backgrounds is atleast equivalent to the proportion in the local communities.
Job Readiness Students prepared for employmentsuccess will have the knowledge ofoccupational choices, skills, workhabits, and job leads necessary for economic self-sufficiency.
High Demand/Emerging Technologies Students are capable of successfully performing in a variety of roles in business and industry including high demand and emerging technology industries.
Career Development Students acquire, maintain, andenhance job skills that remainrelevant in changing jobs markets.
Transferability Students prepared for advanced academic success will have theability and the prerequisite academicexperience sufficient for entry into a four-year college or university.
Enrichment Enrichment opportunities exist to reflect community needs and values.
Change in Board Meetings Policy Governance Agenda A. Focus on Results not Activity B. Preview - Do - Review C. PolGov Early in the Agenda D. Required Approvals Agenda E. Staff Reports (Supplemental) F. Board Chair’s Report G. Meeting Evaluation
Agenda II. Translation of Ends Policies to Strategic Plan and End Metrics - Dwight McElfresh A. Vision/Mission B. Strategic Goals C. Metrics, Assessment Tools, and Baselines
Vision North Central State College is the leader in affordable quality higher education with programs leading to employment and/or academic transfer and a beacon for achieving greater community prosperity and better quality of life.
Mission North Central State College exists for the citizens of its service region to attain the knowledge and skills to succeed in their chosen path of learning, work or enrichment, sufficient for the college to justify available resources
Strategic Plan The strategic plan is the pathway for the achievement of the college’s mission of access and success through the alignment of the human, fiscal and physical resources.
Strategic Goals Access Success Resources
Metrics and Assessment Tools Measure 15 Key Performance Indicators (KPIs) mapped back to the strategic goals and ENDs policy metrics Additional metrics will be captured in a supplemental factbook Reduced KPIs by 50% from initial college scorecard to simplify process and enhance focus
Metrics and Assessment Tools Annual results will continue to be presented against baseline data, as well as measurable goals Results will continue to be presented according to a “stoplight” matrix Green = exceed goal Yellow = between baseline and goal Red = below baseline
Measuring Strategic Goal: Access Provide affordable and viable programs Percent of new programs (< 3 years) over current programs Offer effective and alternative delivery Percent change in credit hours for online, satellite, early college and cohort sections
Measuring Strategic Goal: Access 3. Foster a welcoming and collaborative culture Percent change in annualized head count with supplemental program breakout
Measuring Strategic Goal: Success Uphold a student-centered learning environment Term-to-term retention Fall-to-fall retention Foster student goal completion Aggregate state “success point” index of seven success factors Ohio now factors into subsidy payment Course-level completion in alternate delivery methods
Measuring Strategic Goal: Success 3. Maintain a culture of excellence Graduate Satisfaction Index Employer Satisfaction Index Licensure/Certification Rate
Strategic Goal: Resources Create a great place to work Employee satisfaction measured within an annual national survey Increase fiscal resources and accountability Annual state composite score on fiscal health Annual revenues for foundation and grants
Strategic Goal: Resources 3. Optimize college assets Percent change in facility-related costs per FTE Percent change in instructional technology and equipment costs
Agenda III. Operationalizing the strategic plan using data for student success – Dorey Diab A. Detailed sub-goals B. Changing roles of administration, faculty and staff C. Detailed metrics for student success
Strategic Goal: Access Provide affordable and viable programs (in high demand and emerging technologies) Offer effective and alternative delivery (online, satellites, cohort, block scheduling) Foster a welcoming and collaborative culture (welcoming environment; partnering with high schools, career centers, universities, businesses, government entities, and community organizations; streamlined processes; marketing)
Strategic Goal: Success Uphold a student-centered learning environment (inside and outside the classroom; early alert; support services; intrusive advising; FYE; AtD; CbD) Foster student goal completion (state success factors; course, term to term, year to year, and degree completion; certificates; licensures; pass rates; internships; co-ops) Maintain a culture of excellence (quality, value, assessment, data-based decisions, accreditations)
Strategic Goal: Resources Create a great place to work (integrity, trust, fairness, communication, civility, shared governance, work ethics, diversity, accountability, satisfaction) Increase fiscal resources and accountability (revenues, enrollment, fundraising, grants, efficiencies, balanced budget, financial aid standards) Optimize college assets (facilities, information technology, equipment)
CEO Focus The Board is focused on the results not the activities to ensure that their expectations have been met The Board holds the President/CEO exclusively accountable The job of the president is to use justifiable means to accomplish the Ends Policies through reasonable interpretations of the executive limitations set by the board
Administrative Team Focus Build and carryout the budget underthe philosophy of dedicating and allocating available time and resources to those activities within the executive limitations that promote the achievement of the stated ENDS and avoid those that DO NOT
Faculty/Staff Focus Pursuing/Embracing those activities that produce RESULTS toward achieving theENDS within the executive limitations,instead of those that merely keep us busydoing important work. Hence they are focused on access and success of the students
Metrics - Access Percent of NEW programs and certificates over current programs Percent change in alternate delivery credit hours Percent change in annual student enrollment
Result Example: Access 2. Offer effective and alternative delivery. Percent change from Fall 2012 to 2013:
Metrics - Resources Employee satisfaction Composite OBR accountability score Annual alternative revenues Facilities operating costs per square foot Percent change in instructional technology and equipment expenditures
Result Example: Resources 2. Composite Ratio Score (1-5) of fiscal health based on reserve funds, primary income and level of debt FY 2012: 2.7, compared to 2-year college average of 3.5 FY 2013 score pending finalization. Based on preliminary budget estimates, the college will increase its score for FY 2013.
Metrics - Success Term to term retention Fall-to-fall retention Aggregate state success factors Course completion in alternative delivery methods Graduate satisfaction index Employer satisfaction index Licensure/Certification rate