Download
1 / 46
460 likes | 595 Views
Three Studies to Drive Campus Conversations on Student Success. Rob Johnstone, RP Group. Today we’ll cover:. Working toward a “Culture of Inquiry” – selected findings from statewide projects Grades & Success in Sequenced Courses

E N D
Three Studies to Drive Campus Conversations on Student Success Rob Johnstone, RP Group
Today we’ll cover: • Working toward a “Culture of Inquiry” – selected findings from statewide projects • Grades & Success in Sequenced Courses • Levels of Preparedness in GE Courses – success of simultaneously enrolled students in Math / English courses • Cohort Tracking in Basic Skills
Ground Rules • Ask lots of questions – especially nagging and tough ones • If I’m talking too fast, throw something at me (preferably not something sharp) • Data doesn’t make meaning; we make meaning from data • Spontaneous outbursts of applause are encouraged
Data, Evidence, College Decision-making, Student Success, and You…
How do colleges make good decisions ? If you want to learn you have to take part in the conversation • “Learning emerges from an ongoing conversation about things that matter with both passion and discipline” • Parker Palmer • The Courage to Teach Learning is founded on evidence and inquiry
Framing Thought #1 • “Data do not speak for themselves. What is also needed are occasions that bring educators together to examine evidence about student learning, reflect on its meaning and identify approaches that yield better results.” • Carnegie Foundation (2009)
Framing Thought #2 • Decision making in complex systems is a highly social process, not solely an intellectual exercise. • The process is composed of many small acts, carried out by different people at different points in time.
Institutional Research (IR) & You • IR is about helping the college and its practitioners make better decisions • Institutional research is fundamentally an interventionist discipline. • We are using non-experimental data to examine behavior in complex human systems • We are not seeking absolute truths; rather we are looking for patterns of evidence that inform action-oriented decisions
Linear Model of Institutional Research Primary Responsibility Faculty/Staff Researcher • Key Features: • Request-driven • Highly delineated tasks • Emphasis is on generating metrics
Collaborative Model of Inst. Research Primary Responsibility Faculty/Staff Researcher Joint Activity • Key Features: • Dialogue-rich • Jointly-driven processes
Finding from RP Research Colleges may be focusing on the wrong data.
Twenty Year Trend for Common Institutional Outcome Measures Retention Rate Success Rate • Consider the multitude of changes over this period: • - faculty/staff turnover • program successes/failures • changing student demographics • budget contractions/expansion • evolving state & accreditation mandates • leadership turnover • and yet these performance metrics remained amazingly stable. What does that tell us about the usefulness of these metrics in setting institutional strategies?
An Observation Much of what is needed to support good decision making lies beyond the current grasp of our institutional databases.
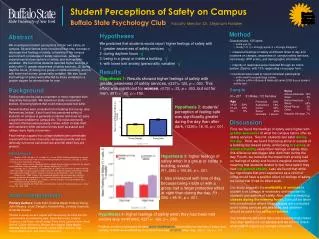
Section 3: Success in GE Courses by Simultaneously Enrolled English / Math Students
Psychology 100 Success of Students Simultaneously Enrolled in English Note: Enrollments from Summer 2000 to Spring 2009; Success is defined as A/B/C/CR grade
Psychology 100 Success of Students Simultaneously Enrolled in Math Note: Enrollments from Summer 2000 to Spring 2009; Success is defined as A/B/C/CR grade
Success in 5 Highly Enrolled GE Courses by English Enrollment Level Note: Enrollments from Summer 2000 to Spring 2009; Success is defined as A/B/C/CR grade
Success in 5 More Highly Enrolled GE Courses by English Enrollment Level Note: Enrollments from Summer 2000 to Spring 2009; Success is defined as A/B/C/CR grade
Success in 5 Highly Enrolled GE Courses by Math Enrollment Level Note: Enrollments from Summer 2000 to Spring 2009; Success is defined as A/B/C/CR grade
Success in 5 More Highly Enrolled GE Courses by Math Enrollment Level Note: Enrollments from Summer 2000 to Spring 2009; Success is defined as A/B/C/CR grade
Cohort Tracking • Cohorts tracked include students whose first math course at Skyline was between 2002-03 and 2006-07. Students were tracked for three academic years. • Students were tracked based on the first math/English/ESL course that they took at Skyline (not on their placement).
Math Cohort Tracking – Starting in Fundamentals 65% 33% 11% 5%
Math Cohort Tracking – Starting in Beginning Algebra 67% 27% 13%
Math Cohort Tracking – Starting in Intermediate Algebra 72% 31%
English Tracking – Starting in Two Levels Below Transfer 67% 40% 25% 16%
English Tracking – Starting in One Level Below Transfer 74% 46% 29%
ESL Tracking – Starting in Pre Intermediate 68% 35% 22% 11%
ESL Tracking –Starting in Intermediate 69% 37% 22%
Something to consider… Math Progression 65% 33% 11% 5% 67% 27% 13% 72% 31% English Progression ESL Progression 67% 40% 25% 16% 68% 35% 22% 11% 74% 46% 29% 22% 69% 37% 79% 42% 34% 66%
Something to consider… Math Progression Math Progression 65% 65% 33% 33% 11% 11% 5% 5% 67% 67% 27% 27% 13% 13% 72% 31% 72% 31% English Progression English Progression ESL Progression ESL Progression 67% 67% 40% 40% 25% 25% 16% 16% 68% 68% 35% 35% 22% 22% 11% 11% 74% 46% 74% 46% 29% 29% 22% 69% 37% 69% 37% 22% 79% 42% 79% 42% 34% 66% 34% 66%
Something to consider… Math Progression 65% 33% 11% 5% 67% 27% 13% 72% 31% English Progression ESL Progression 67% 40% 25% 16% 68% 35% 22% 11% 74% 46% 29% 69% 37% 22% 79% 42% 34% 66%
BRIC TAP Core Team Rob Johnstone, Project Director johnstoner@smccd.edu Priyadarshini Chaplot, Project Coordinator pchaplot@rpgroup.org Lead Technical Coaches Darla Cooper Janet Fulks Bob Gabriner Cathy Hasson Ken Meehan Bob Pacheco Greg Stoup Ian Walton
Find Out More! RP Group Website www.rpgroup.org BRIC TAP http://www.rpgroup.org/projects/BRIC.html Rob Johnstone, BRIC Project Director johnstoner@smccd.edu Kathy Booth, RP Group Executive Director kbooth@rpgroup.org Priya Chaplot, BRIC Project Coordinator pchaplot@rpgroup.org