Download
1 / 32
690 likes | 1.04k Views
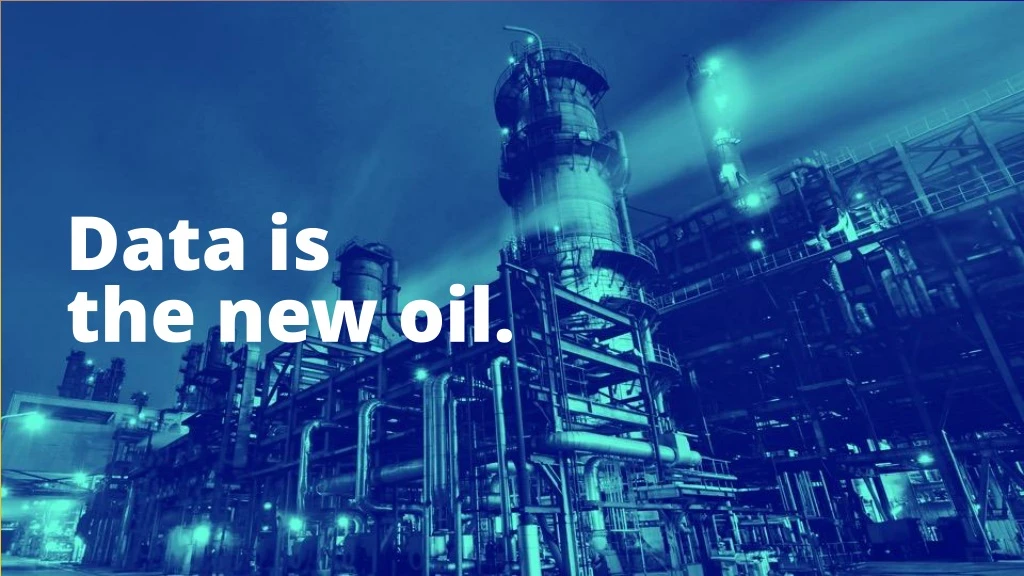
Data is the new oil. “Data is the New Oil… ”. Understanding the “Economics of Oil” requires understanding the difference in value between “Raw” Oil and “Refined” Oil.

E N D
Data is the new oil.
“Data is the New Oil…” Understanding the “Economics of Oil” requires understanding the difference in value between “Raw” Oil and “Refined” Oil But how much more valuable is that barrel of high-octane fuel if that barrel never depletes, never wears out and can be used across unlimited use cases? * as of 04/04/2019
Driving Business Strategies with Data Science Bill Schmarzo Hitachi Vantara CTO, IoT and Analytics University of San Francisco, Executive FellowHonorary Professor, National University of Ireland-Galway Twitter: @Schmarzo
Big Data Business Model Maturity Index How Effective is Your Organization at Leveraging Data and Analytics to Power your Business Models? DIGITALTRANSFORMATION Key Business Processes Big Data Economics INSIGHTSMONETIZATION BUSINESS OPTIMIZATION BUSINESS INSIGHTS BUSINESS MONITORING PrescriptiveRecommendations
Data Science Value Engineering Framework Business Initiative Stakeholders Decisions Analytics Data Architecture & Technology
Every Two Days We Create As Much Information As We Did From The Dawn Of Civilization Until 2003 - Eric Schmidt, Google CEO A Billion People Visit Facebook Every Day - Business Insider By 2018, Leading Enterprises Will Support 1,000–10,000 TIMES More Customer Touch Points - IDC 8
“Internet of Things” (IOT) Causing Data Explosion 30 BillionCONNECTED DEVICES 7 BillionCONNECTED PEOPLE MillionsOF NEW BUSINESSES Source: Gartner Group, 2014 44 ZettabytesOF DATA
Personal Experiences Changing Corporate Expectations Recommends movies, restaurants, friends, spouses, books, routes, etc.
Big Data Isn’t About Big…it’s About Small INCLINATIONS AFFINITIES PROPENSITIES PASSIONS AFFILIATIONS INTERESTS TASTES BIASES PREFERENCES ASSOCIATIONS BEHAVIORS TENDENCIES Source: Bill Schmarzo “Big Data MBA” Course Curriculum 11
Big Data isn’t about Big…it’s about Small PROPENSITIES AFFINITIES AFFILIATIONS INCLINATIONS PREFERENCES BIASES TRENDS PATTERNS BEHAVIORS TENDENCIES Source: Bill Schmarzo “Big Data MBA” Course Curriculum
What is Data Science? Data Science: Identifying variables and metrics that might be better predictors of performance 2000 2001 2002 2003 2004 2005 2013 14
Analytics Monetization Curve Prescriptive Actions(What should we do?) Plant X and Y crops across N acres Pre-order X amount of fertilizer at 5% discount Service your harvester and tractor #2 in January Hire X number of workers for Y days Descriptive Questions(What happened?) • What were revenues and profits last year? • How much fertilizer did I use last planting season? • How much downtime did I have last month due to unplanned equipment maintenance? • How many workers did I use last month? Predictive Analytics(What is likely to happen?) What will revenues & profits likely be next year…? How much fertilizer will I likely need next planting season…? When will my equipment likely need maintenance next month…? How many workers will I likely need next month and when will I need them…?
The Art of “Thinking Like A Data Scientist” 3 4 1 2 Identify Business Initiative Identify Stakeholders Identify Analytic Entities Identify / Prioritize Use Cases 6 7 8 5 IdentifyData Sources Group Metrics Into Scores IdentifyRecommendations Map Scores to Recommendations
Data Science Collaborative Engagement Process Supports rapid exploration, rapid testing, continuous learning “Scientific Method” Kronos Historical Weather Forecast Google Trends PhysicianNotes Local Events CDC Step 1: Define Hypothesis (Decision)to test or Prediction to make Epic Lawson Step 2: Gather data…and more data (Data Lake: SQL + NoSQL) Step 3: Prepare data; Build schema (schema-on-query) Step 4: Visualize the data (Tableau, Pentaho, ggplot2,…) REPEAT Step 5: Build analytic models (TensorFlow, Python, Jupyter…) Step 6: Evaluate model “goodness of fit” (coefficients, confidence levels) Source: “Scientific Method: Embrace the Art of Failure”, University of San Francisco School of Management Big Data MBA
Saddle Point Optimization Challenges Optimization paths (A and B) may top out sooner with lower “Saddle Points” than optimal path (C). Data scientist must be prepared to jettison current path to find more predictive path. C B A
01 Increase Same Store Sales by X% 10/27 Schmarzo (3) Business Value (1) Hypothesis (11) Impediments Increase Same Store Sales by 7.1% over the next 12 months • Increased top line revenue • Better (faster) customer experience • Fresher inventory • Increase overall profits • Increased asset utilization • Lack of quality data • Lack of analytic skills to create predictions • Store/Field Management buy-in • Modern technology architecture • Financing/budget (2) KPI’s Average Sales per Visit, Store Traffic, Sales per Employee, Line Wait Time, % Abandonment, Mobile Orders, Positive Social Media Mentions, Table Turns (6) Decisions (5) Entities (4) Stakeholders (12) Risks • Stores • Customers • Suppliers • Store Managers • Competitors • Store Operations • Corporate Marketing • Field Marketing • Procurement • Finance • Staffing • Local Events Sponsorship • Promotions & Types • Corporate Catering • Loyalty Program • Non-corporate Catering • Inventory Management • Suppliers • Customer Satisfaction • New Product Intros • Poor execution affects customer satisfaction • Increased demand stresses employee satisfaction • Weather disrupts local events • Increased demand impacts product quality • Suppliers can’t keep up with increased demand (7) Predictions (8) Data (10) Recommendations • Demand (Traffic) Forecast • Promotional Response • Basket Size • New Product Demand • Staff Availability • Abandonment • Mobile Orders • Weather • Recommend Inventory • Recommend Catering Targets • Recommend Staffing • Recommend Local Events Promotions • Recommend Store Hours (14) Impediments Assessment (13) Financial Assessment (9) Variables (Dimensions) • Day of week (weekends) • Holidays • Seasonality • Weather conditions • Traffic patterns • Miles from high school • Miles from mall • Local sporting events • Store location • Store size • Store open date • Local demographics • Local house values • Local economics • Products sold • Time of day
“ Design Design and Data Science Data Science uncovers and codifies the trends, patterns and relationships buried in data Design Thinking uncovers and codifies the trends, patterns and relationships buried in people ”
Why Design Thinking and Data Science? Converting Hunches, Heuristics and Rules of Thumbs into Math “The secret to moving organizations from mystery and heuristics to algorithms lies in the ability of Design Thinking to uncover and codify the deep knowledge and insights of the organization’s subject matter experts” - Bill Schmarzo Mystery Heuristics Algorithm
Design thinking involves observation to discover unmet needs within the context and constraints of a particular situation. It frames the opportunity and scope of innovation, generating creative ideas, testing and refining solutions. It creates a repeatable and scalable process for innovation. Model one or more of your ideas to show to others. How can I show my idea? Remember: A prototype is just a rough draft. Learn about audience for whom you are designing. Who is my user? What matters to this person? Brainstorm as many creative solutions as possible. Wild ideas encouraged! Create POV based on user needs and insights. What are their needs? Share prototype for feedback. What worked? What didn’t? Design Thinking Ideate Empathize designs products this way… Define Prototype Human-centered Test refines, tunes and predicts this way… Analyze Ideate Machine Learning Synthesize Tuning Break down needs into each of base parts (decisions) Brainstorm to process the product requirement into: -Feature maps -Classes -Metrics -Adaptive needs Validate Machine learning is a method of data analysis that automates analytical model building. Using algorithms that iteratively learn from data, machine learning allows computers to find hidden insights without being explicitly programmed where to look. Tune the model to boost accuracy. Avoid ‘over-fitting’ Combine separate elements in order to create a new ‘whole’ Machine-centered Meet inference performance metrics. Avoid ’over-fitting’ Source: John Morley & Bill Schmarzo
Exploiting the Economic Value of Data University of San Francisco Economic Value of Data Research Project Bill Schmarzo Hitachi Vantara CTO, IoT and Analytics University of San Francisco, Executive FellowHonorary Professor, National University of Ireland-Galway Twitter: @Schmarzo
Economic Value of Data Research Data is an asset that never depletes, never wears out, and can be used across unlimited use cases at near zero marginal cost • Economic Multiplier Effect: an increase in spending produces an increase in value greater than the initial amount Sales Marketing Call Center Product Dev Promotional effectiveness Customer acquisition Customer retention New product intro Customer point of sales data +2.5% +2.0% +3.5% +2.6%
How does the organization determinethe economic value of its data in order to drive prioritization and investment decisions? How does the organization avoid data silos andshadow IT spend that thwarts potential value of data? How does the organization avoid the disillusionment of “orphaned analytics”? Intellectual Capital “Rubik’s Cube” Challenges How does one leverage an asset that appreciates (not depreciates) with usage, and can be used simultaneously across multiple business processes?
Intellectual Capital “Rubik’s Cube” Solution USE CASES Clusters of decisions around common subject area in support of organization’s key business initiatives ANALYTICS DATA Detailed historical transactions coupled with internal unstructured and publicly-available data sources Data transformed into actionable analytic insights (scores, rules, propensities, segments, recommendations)
“Economies of Learning” versus “Economies of Scale” SMART FACTORY SMART CITY • “Economies of Scale” have given large enterprises unsurmountable market advantages through exploitation of mass production, distribution and marketing. • In knowledge-based industries, “Economies of Learning” more powerful than the “Economies of Scale” • Today, every industry is becoming a knowledge-based industry SMART HOSPITAL SMART AIRPORT
Schmarzo Economic Digital Asset Valuation Theorem The more the data and analytics get used, the more accurate, more complete, more robust, more predictive and consequently more valuable they become Hi Effect #3: Economic Value Accelerates • Refining Analytic Module predictive effectiveness ripples thru previous use cases that use that Analytic Module Value ($$$) Effect #2: Economic Value Grows • Cumulative financial and operational value grows use case by use case Effect #1: Marginal Costs Flatten • Reusing “curated” data and analytic modules reduces marginal costs for new use case (no data silos or orphaned analytics) Lo Number of Use Cases
3 Horizons of Digital Transformation How do organizations exploit new digital technologies, real-time data, advanced analytics and communication channels to digitally transform their business and operational models? Aspirational Agriculture Company Horizon 3: Autonomous Farming Exploit analytics-infused automation technologies and deep customer, product and operational insights to create Autonomous Farming-as-a-Service business model Horizon 3 Create New Markets Horizon 2: Digital Farms Create Digital Farms that self-monitor, self-diagnose and self-heal by exploiting equipment, farming usage patterns, soil, crop, pesticide/herbicide, weather, commodities pricing and operational insights Horizon 2 Transform Existing Business Model Horizon 1: Farming Excellence Optimize farming operationalmanagement via yield optimization, waste and energy reduction,predictive maintenance, resource scheduling, machinery utilization, inventory optimization, asset lifecycle management etc. Horizon 1 Optimize ExistingOperations Today
University of San FranciscoEconomic Value of Data Research Project Data isnot the new oil. Data is unlike any other corporateasset It never depletes Data is the new sun. It never wears out Same data set can be used acrossinfinite use cases Source: Bill Schmarzo “Big Data MBA” Course Curriculum
Bill Schmarzo BILL SCHMARZO Hitachi Vantara CTO, IoT and Analytics University San Francisco School of Management, Executive Fellow Honorary Professor, National University of Ireland-Galway Top-ranking Blogs • To Achieve Big Data’s Potential, Get It into the Boardroom • Big Data Business Model Maturity Index • 6 Laws of Digital Transformation • History Lesson on Economic-Driven Business Transformation • User Experience: The New King of the Business • IOT: Transitioning from Connected to “Smart” • Learning How to “Think Like a Data Scientist” Contact Information Bill.Schmarzo@HitachiVantara.com Find me on Twitter: @schmarzo