Download
1 / 29
370 likes | 528 Views
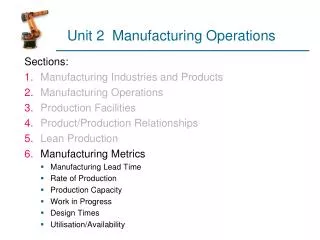
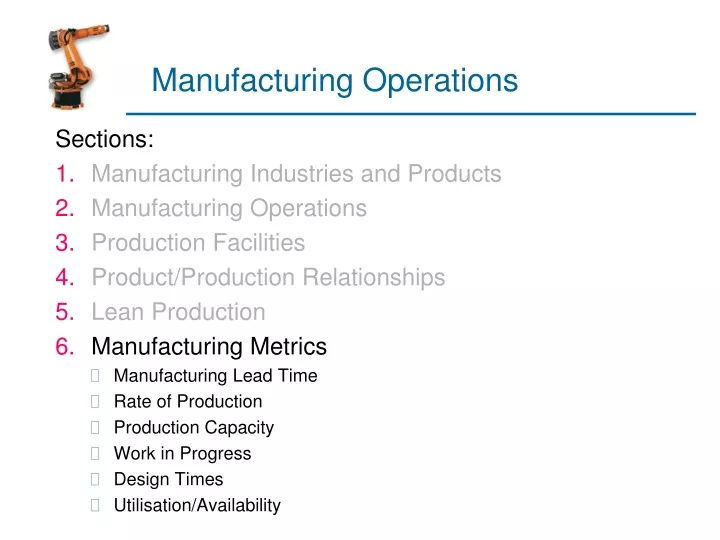
Manufacturing Operations. Sections: Manufacturing Industries and Products Manufacturing Operations Production Facilities Product/Production Relationships Lean Production Manufacturing Metrics Manufacturing Lead Time Rate of Production Production Capacity Work in Progress Design Times

E N D
Manufacturing Operations Sections: • Manufacturing Industries and Products • Manufacturing Operations • Production Facilities • Product/Production Relationships • Lean Production • Manufacturing Metrics • Manufacturing Lead Time • Rate of Production • Production Capacity • Work in Progress • Design Times • Utilisation/Availability
Industrial AutomationArchitecture Level 4 Business Information (Business Office) Level 3 Level 2 Level 1 Industrial Automation (Shop Floor) Level 0
Manufacturing Lead Time Raw Materials Work in Progress Finished Goods Machine Group Transport Stores Inspect • Operating Times • Non-operating Times
Manufacturing Lead Time 30% Cutting 70% Positioning, Loading e.g. Set-up Time 5% On Machine 95% Moving and Waiting Time 1.5% of total time - adds value
Manufacturing Lead Time n1 n2 n3 Time Operation Time Non-operation Time To = Operation Time per Machine Tno = Non-operation Time per Machine nm = Number of Machines MLT = nm ( To + Tno )
Manufacturing Lead Time n1 n2 n3 Pallet of six parts Q = Number of parts MLT = nm ( QTo + Tno )
Manufacturing Lead Time n1 n2 n3 Pallet of six parts Tsu = Set-up Time MLT = nm ( QTo + Tno + Tsu )
Manufacturing Lead Time Order #1 Order #2 Process Plan (Routing)
Manufacturing Lead Time In practice Q, Tsu, To, Tno and nm will vary considerably for different order quantities, process routing to find average or aggregate values before carrying out analysis. e.g.:
Operation Times Operation time has three elements: Tm = Actual Machining Time Th = Workpiece Handling Time Tth = Tool Handling Time To = Tm + Th + Tth
Rate of Production • Total Batch Time per Machine Tsu + QTo • Average Production Time per Part Tp = Tsu + QTo Q • Rate of Production Rp = 1/Tp
Lead Times Job Shop (Q -> 1) Mass Production (Tsu + Tno -> 0)
Production Capacity Production Capacity, Pc Pc = WSwHRp W = number of work centres Sw = Number of shifts per week H = Hours per shift Rp = Rate of production (units per hour) If process plan requires Nm machines: Pc = WSwHRp / Nm
Demand Rate Weekly Demand Rate Dw = WSwHRp / Nm WSwH = DwNm/ Rp Three ways of adjusting capacity W (number of work centres) Sw (number of shifts per week) H (number of hours per shift i.e. overtime)
Work In Progress WIP : Amount of product currently located in the factory that is either being processed or is in between processing operations Generally: WIP = PC U (MLT) / Sw H
WIP Ratio WIP Ratio = WIP / Number of Machines Processing PC U Sw H (MLT) WIP Ratio = QTo Tsu + QTo W U Ideal ratio: 1:1
Design Model Design Process generally involves six stages • Recognition of need • Definition of Problem • Synthesis • Analysis and Optimisation • Evaluation • Presentation
Design Model Many engineering hours spent in Design Let T1 = Time spent producing one unit of product T2 = Time spent planning and setting up production T3 = Time spent on design B = Aggregate number of batches produced Q = Aggregate batch size
Design Model Aggregate total time spent during life of product TTLC = BQT1 + BT2 + T3 Average time spent on each product TLC = T1 + T2 /Q + T3/BQ
Design Model In Mass Production and Batch Production T2 and T3 can be spread out among large number of units - dominant factor is T1 - automation is important In Job Shop Production all three times are important. T2 and T3 may become dominant terms - CAD/CAM is important
Worked Problem The average part produced in a certain batch manufacturing plant must be processed sequentially through six machines on average. Twenty (20) new batches of parts are launched each week. Average operation time = 6 min., average setup time = 5 hours, average batch size = 25 parts, and average non-operation time per batch = 10 hr/machine. There are 18 machines in the plant working in parallel. Each of the machines can be set up for any type of job processed in the plant. The plant operates an average of 70 production hours per week. Scrap rate is negligible. Determine (a) manufacturing lead time for an average part, (b) plant capacity, (c) plant utilization. (d) How would you expect the nonoperation time to be affected by the plant utilization?
Utilisation, U = Output/Capacity Utilization: U = where Q = quantity actually produced PC = plant capacity Utilisation
Availability • Availability: A = where MTBF = mean time between failures, and MTTR = mean time to repair
Costs of Manufacturing Operations Fixed costs - remain constant for any output level Variable costs - vary in proportion to production output level Adding fixed and variable costs TC = FC + VC(Q) where TC = total costs FC = fixed costs (e.g., building, equipment, taxes) VC = variable costs (e.g., labor, materials, utilities) Q = output level
Breakeven Point Method 1: Manual Costs Method 2: Automated VC2 FC2 VC1 Breakeven Point FC1 Quantity, Q
Manufacturing Costs • Alternative classification of manufacturing costs: • Direct labor - wages and benefits paid to workers • Materials - costs of raw materials • Overhead - all of the other expenses associated with running the manufacturing firm • Factory overhead • Corporate overhead
Overhead Rates Factory overhead rate: FOHR = Corporate overhead rate: COHR = where DLC = direct labor costs
Cost of Equipment Usage Hourly cost of worker-machine system: Co = CL(1 + FOHRL) + Cm(1 + FOHRm) where Co = hourly rate, €/hr CL = labor rate, €/hr FOHRL = labor factory overhead rate Cm = machine rate, €/hr FOHRm = machine factory overhead rate
Worked Problem • The break-even point is to be determined for two production methods, one a manual method and the other automated. The manual method requires two workers at €9.00/hr each. Together, they produce at a rate of 36 units/hr. The automated method has an initial cost of €125,000, a 4-year service life, no salvage value, and annual maintenance costs = €3000. No labour (except for maintenance) is required to operate the machine, but the power required to run the machine is 50 kW (when running). Cost of electric power is €0.05/kWh. If the production rate for the automated machine is 100 units/hr, determine the break-even point for the two methods, using a rate of return = 25%. The solution requires familiarity with the Uniform Annual Cost (UAC) method of determining an annual amount payable (A) on a principle sum (P).