Download
1 / 12
120 likes | 123 Views
Spatiotemporal Cluster Detection in ESSENCE Biosurveillance Systems. Panelist: Howard Burkom National Security Technology Department, John Hopkins University Applied Physics Laboratory DIMACS Working Group Workshop on Analytical Methods for

E N D
Spatiotemporal Cluster Detection in ESSENCE Biosurveillance Systems Panelist: Howard Burkom National Security Technology Department, John Hopkins University Applied Physics Laboratory DIMACS Working Group Workshop on Analytical Methods for Surveillance of Multidimensional Data StreamsRutgers University, Piscataway NJ February 19, 2004
Problem/Data Context of ESSENCE Surveillance Systems Hosp ER Admissions SalesofOTC Remedies Absentee Rates Physician Office Visits Normalization Analysis Fusion Counts/Clusters of Statistical Significance Who? What? Where? When? Epidemiological Significance
Applying Statistical Process Control to Multiple Data Streams • Multiplicity from intertwined effects: multiple data sources, regions, strata (syndrome groups, product groups) • Multiple univariate methods • Critical issue: use individual detector outputs without getting overwhelmed by multiple testing • Low power for anomalies spread over inputs • Multivariate methods • Critical issue: need modifications to reduce alerts due to irrelevant changes in data relationships • Need to retain power in individual source data
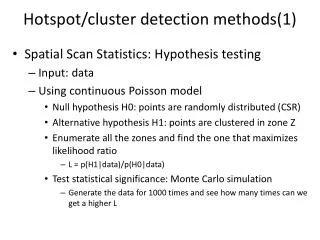
Significance Assessment: Multiple Univariate Alerting Algorithms • Bonferroni bound: replace a by a/N • Alert based on individual outputs (conservative) • Edgington’s “consensus” method (1972) • Combined prob from alg. comb .of N individual p-values • Z-score approximation: ( mean(p-values) – 0.5 ) / ( 0.2887 / √N ) • Bayes Belief Net • Originated effort to add sensor data, intelligence info,… • Recently applied to separate algorithm outputs • Can weight each type of information based on training data and/or intuition • Configurable to soften thresholds for evidence accrual
Multivariate Alerting Strategies • Variants of Hotelling’s T2 m = vector mean est. from current baseline S = est. of covariance matrix calc. from baseline X = multivariate (filtered?) data from test interval T2 statistic: (X- m) S-1(X- m) (Ye et al, 2002) • “Neighbor-regression” preconditioning strategy of Hawkins; removal of covariance effects • MEWMA (Lowry), MCUSUM (Crosier, Pignatiello/Runger) • Numerous strategies, adaptations to Poisson data • But which is appropriate for multivariate syndromic data streams? • Can EWMA/Shewhart (or CUSUM/Shewhart) encompass both point-source “bioweapon” epicurve and seasonal endemic=>epidemic outbreak?
Detection Challenge: faint rise in all 3 data sets Respiratory Syndrome Data Counts Military Dx Military Rx Civilian Dx
Detection Challenge: faint rise in all 3 data sets Respiratory Syndrome Data Counts Lowry’s MEWMA: Day 4 alert at each FA rate
Scan Statistics for Biosurveillance Scarlet Fever Outbreak Study Analysis of Claims Data in National Capital Area ICD9 codes for scarlet fever: 034 034.1 10 cases, 5 days p = 0.013 15 cases, 12 days p = 0.002 11 cases, 7 days p < 0.001
Surveillance combining outpatient visits, OTC anti-flu sales, school absenteeism
Practical Issues in Spatiotemporal Monitoring and Evaluation • Control needed for mismatched scales & variances among data sources • To retain power in indiv. sources, gain combined sensitivity • Difficult to assess delays, relative scales of effects among separate sources, in both background & signal • Simulation much harder to validate • If distance matrix is used, it should reflect proximity according to the epidemiological case definition: • Modifications to reflect plausible demographic behaviors • The importance of significance testing grows with the number of sources, especially for subregions where expected counts are low • More sources => more small spurious clusters
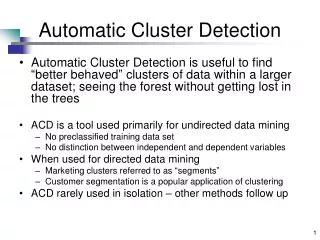
Finding Clusters with Multiple Data Sources • For candidate cluster J1, the Kulldorff likelihood ratio is: • LR(J1) ≡ (O1/E1)O1* ((N-O1) / (N-E1)) (N-O1) • where O1 = number of cases inside J1, • E1 = number of cases outside J1, • N = total case count • Extension by treating multiple sources as covariates: • O1 = SO1k, E1 = SE1k, N = SNk, for sources k=1,…,K • “adjusted method”: problem of adding sources with mismatched scales, variances • Alternate multisource approach: “stratified” scan statistic • S log( LR(J1k) ), k=1,…,K • reduces chances for a noisy source to overwhelm others • can cost power to detect faint signal spread over sources
FROC Performance Assessment Adjusted vs Stratified Multisource Scan Statistics Prob. Signal-Based Significant Cluster Prob. Random Background Significant Cluster